Visual Studio basics
Overview
Teaching: 0 min
Exercises: 10 minQuestions
How to run sample CUDA code in Visual Studio, ex deviceQuery?
What are the specs for your NVIDIA GPU?
How do you build (compile), run and debug in VS (Visual Studio)?
Objectives
Learn how to build (compile), run and debug CUDA code using VS.
Visual Studio has a steeper learning curve compared to other IDEs. Let’s cover the basics for building/compiling, running and debugging CUDA sample code.
The first sample code you should always run is “deviceQuery”. It is the most basic program and it confirms that the Windows/GPU/Visual Studio/CUDA setup is correctly configured. In addition, it will give you the specifications of your NVIDIA GPU.
First, we need to open up the Visual Studio application. One way to start up VS was discussed in the previous section. Another way is by double clicking on a VS solutions file. See the red circle in the picture below.
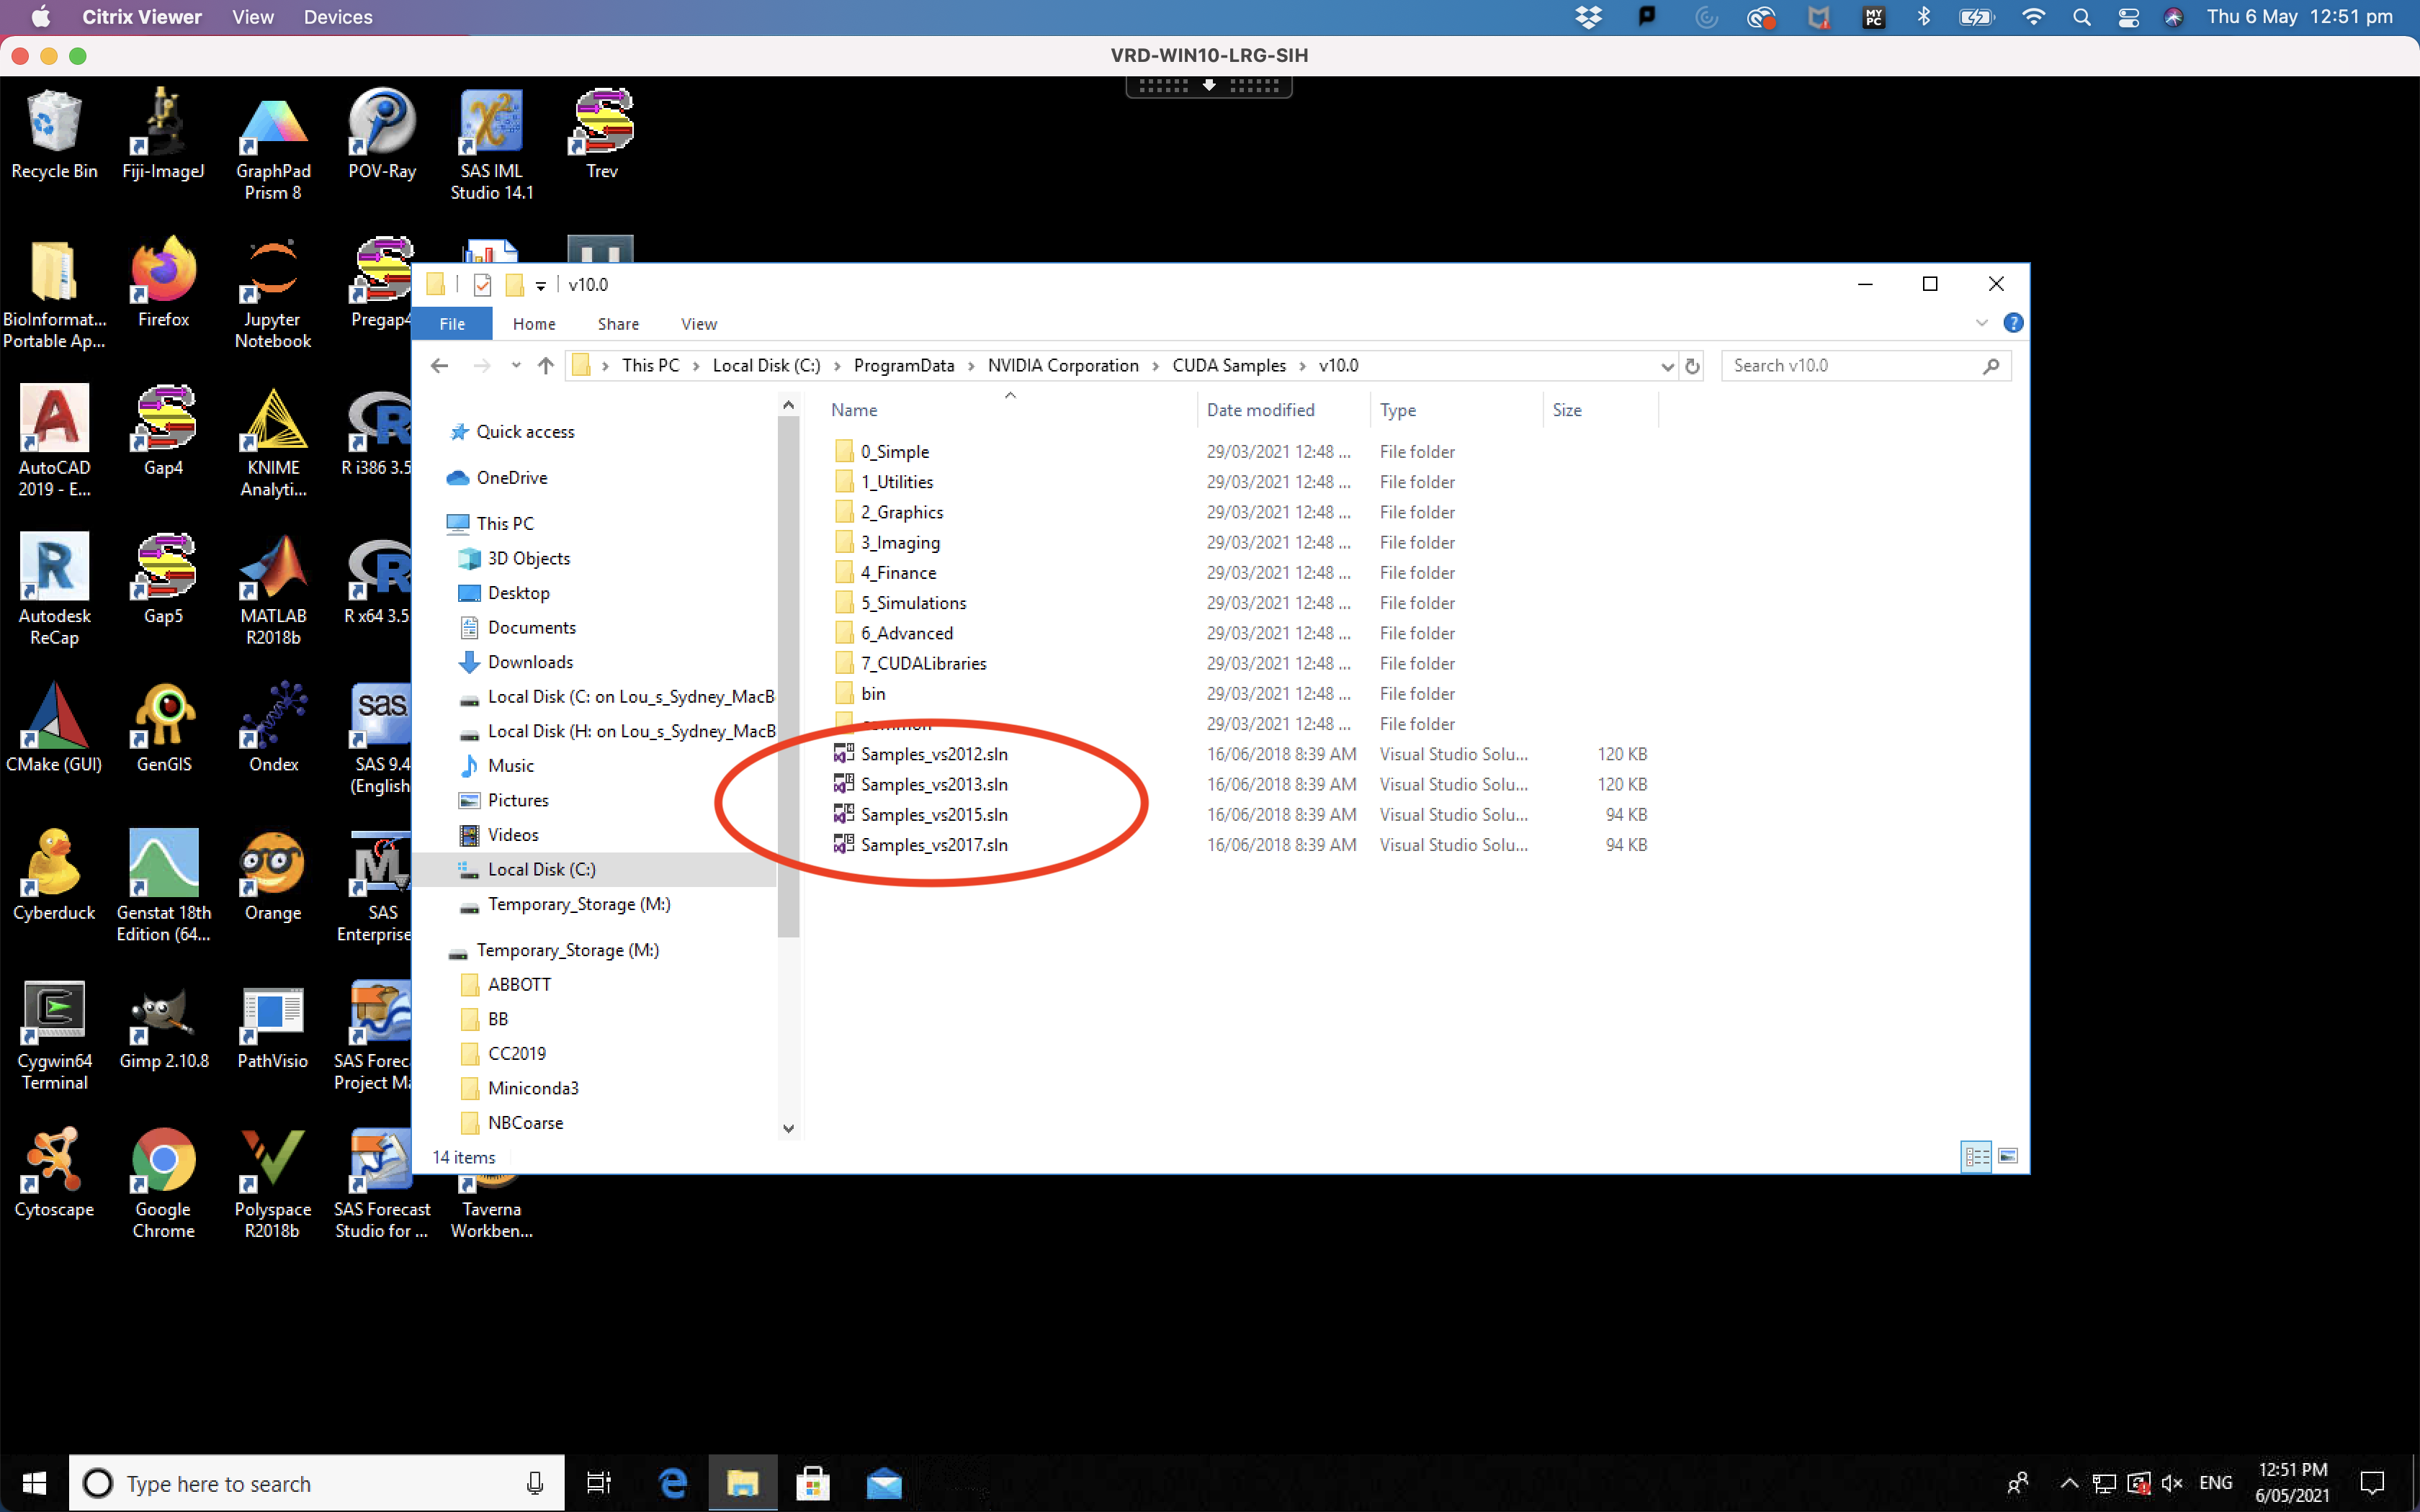
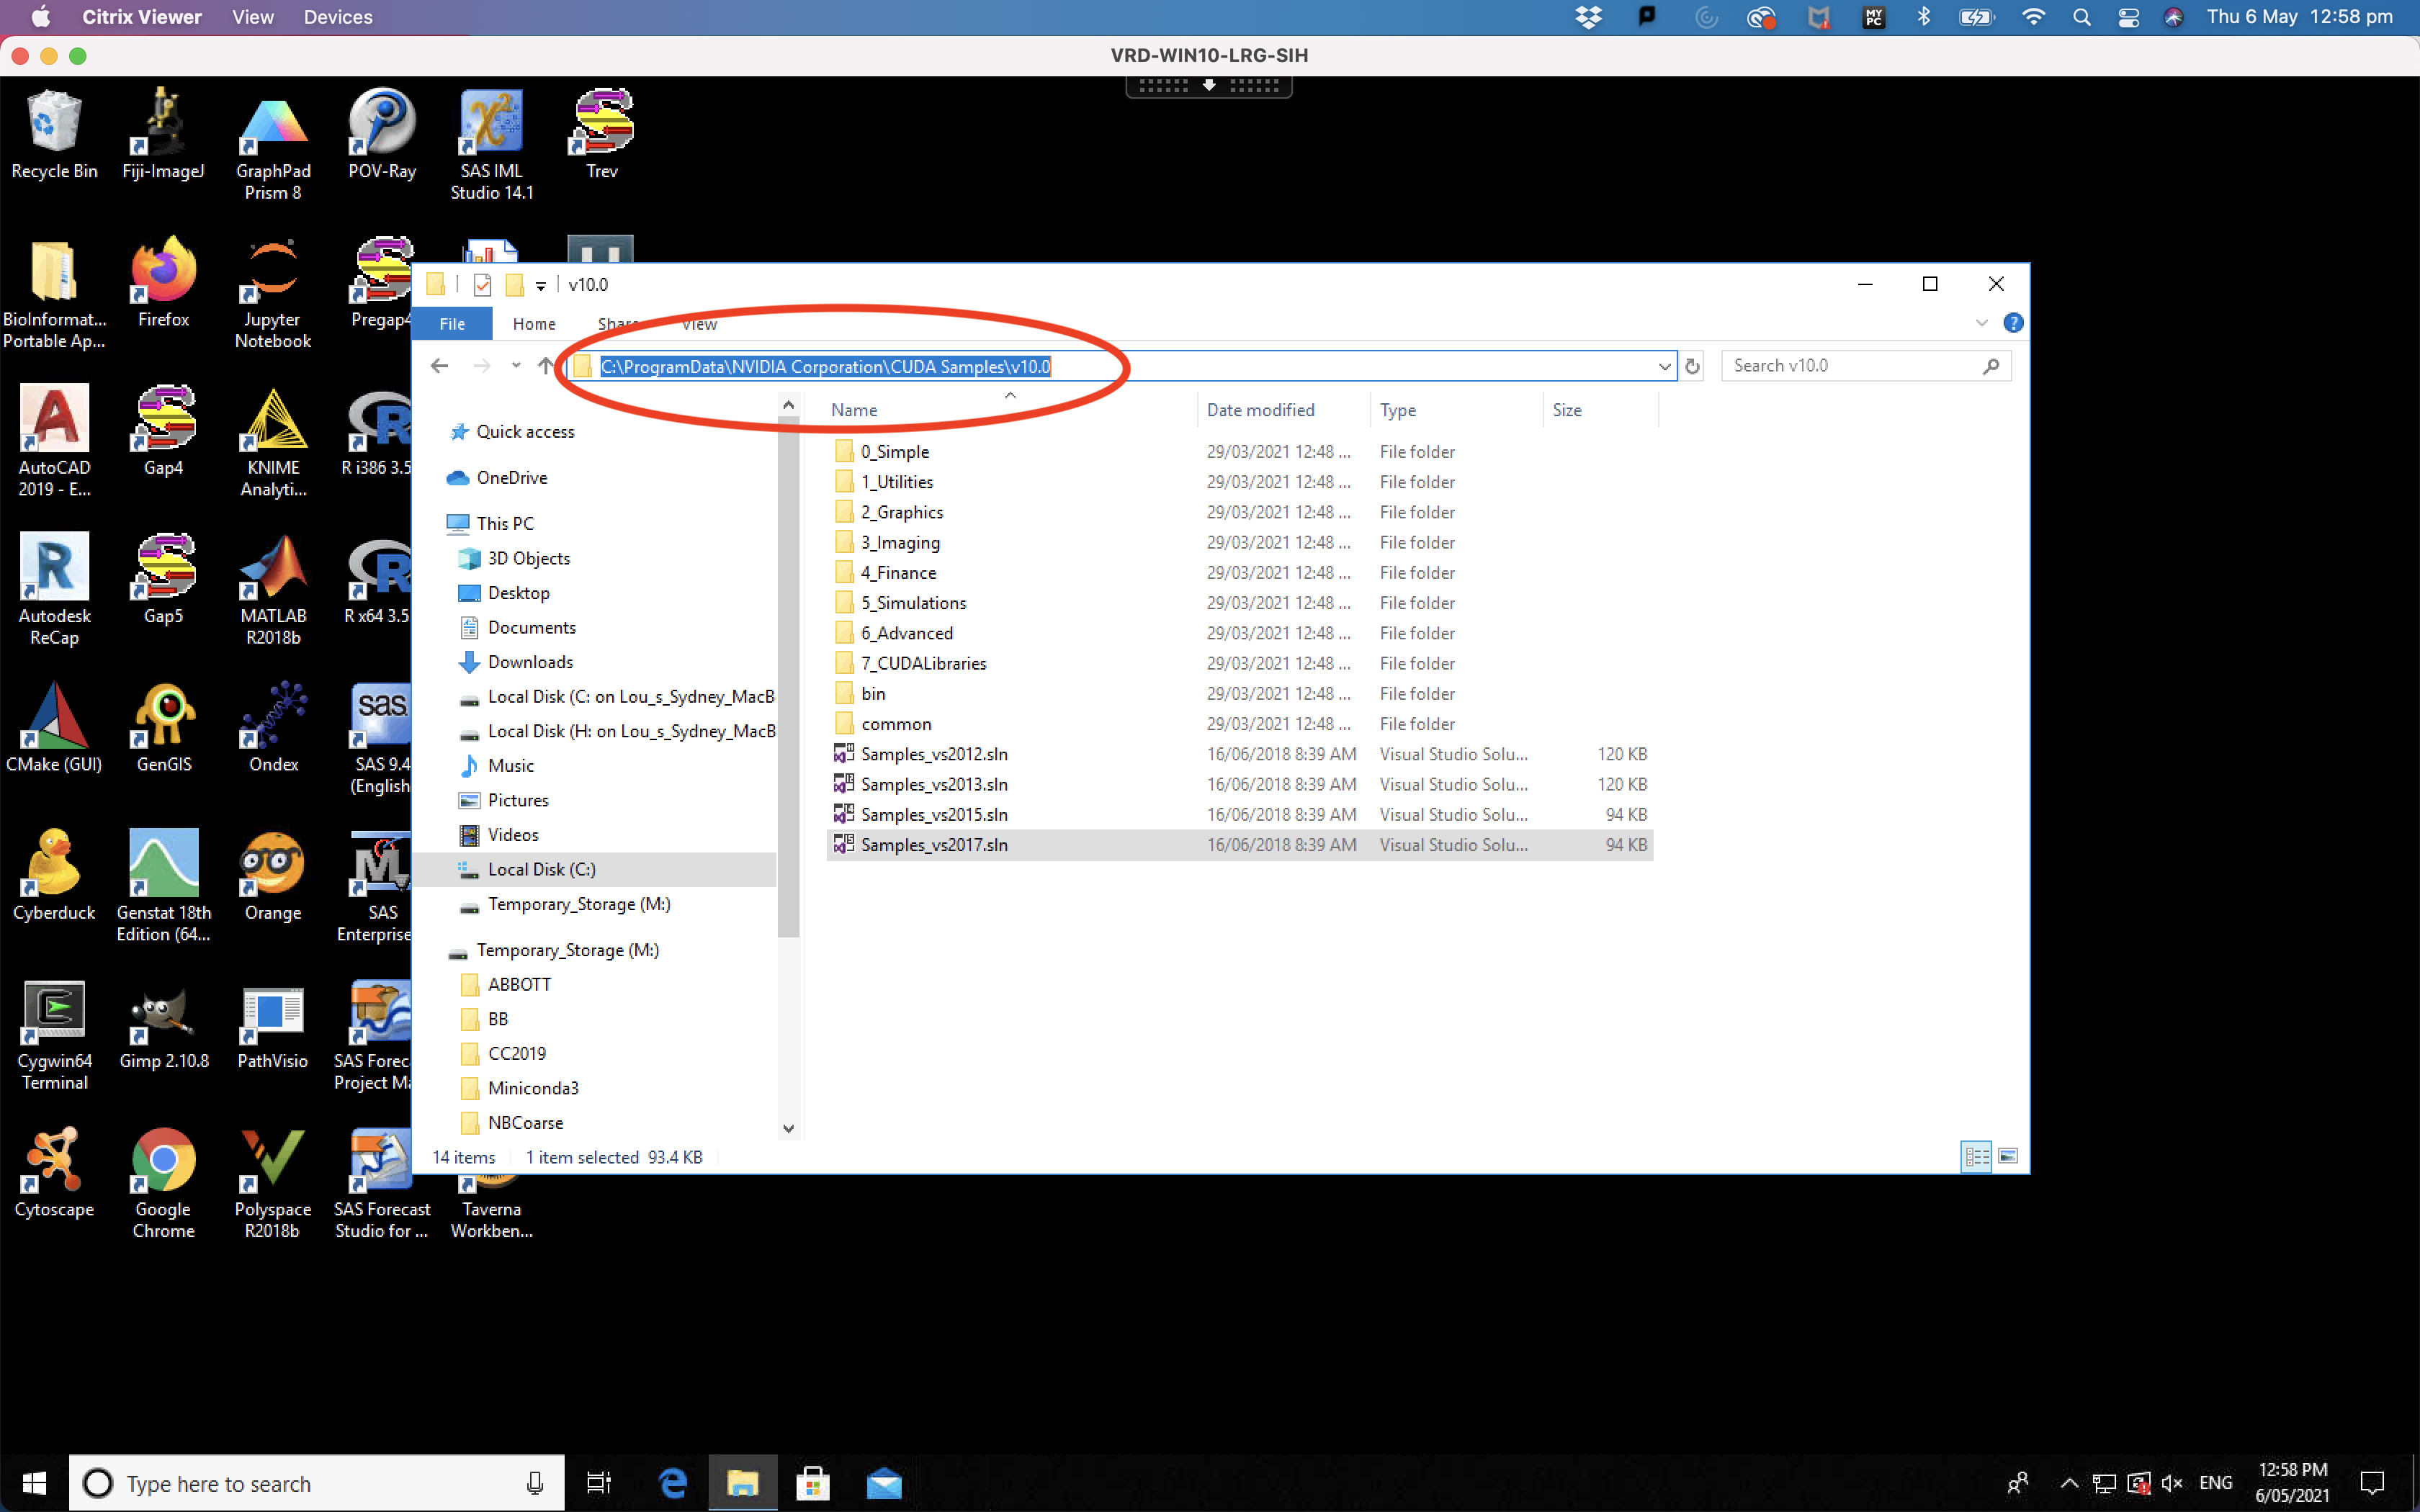
First we have to navigate to the path where the CUDA solutions are stored. Unfortunately, the “ProgramData” directory is typically hidden on most Windows machines. So we can not use our normal method of navigation using directory folders. We MUST manually type the path in the file explorer window. See the red circle in the picture below.
or change directory to the following “C:\ProgramData\NVIDIA Corporation\CUDA Samples"
NOTE that you need drive letter, in this case “C:” in front of the path AND the slashes are backward “" instead of forward “/”. For users of linux and MacOS, this is a subtle but critical difference in path nomenclature.
figure>
 </figure>
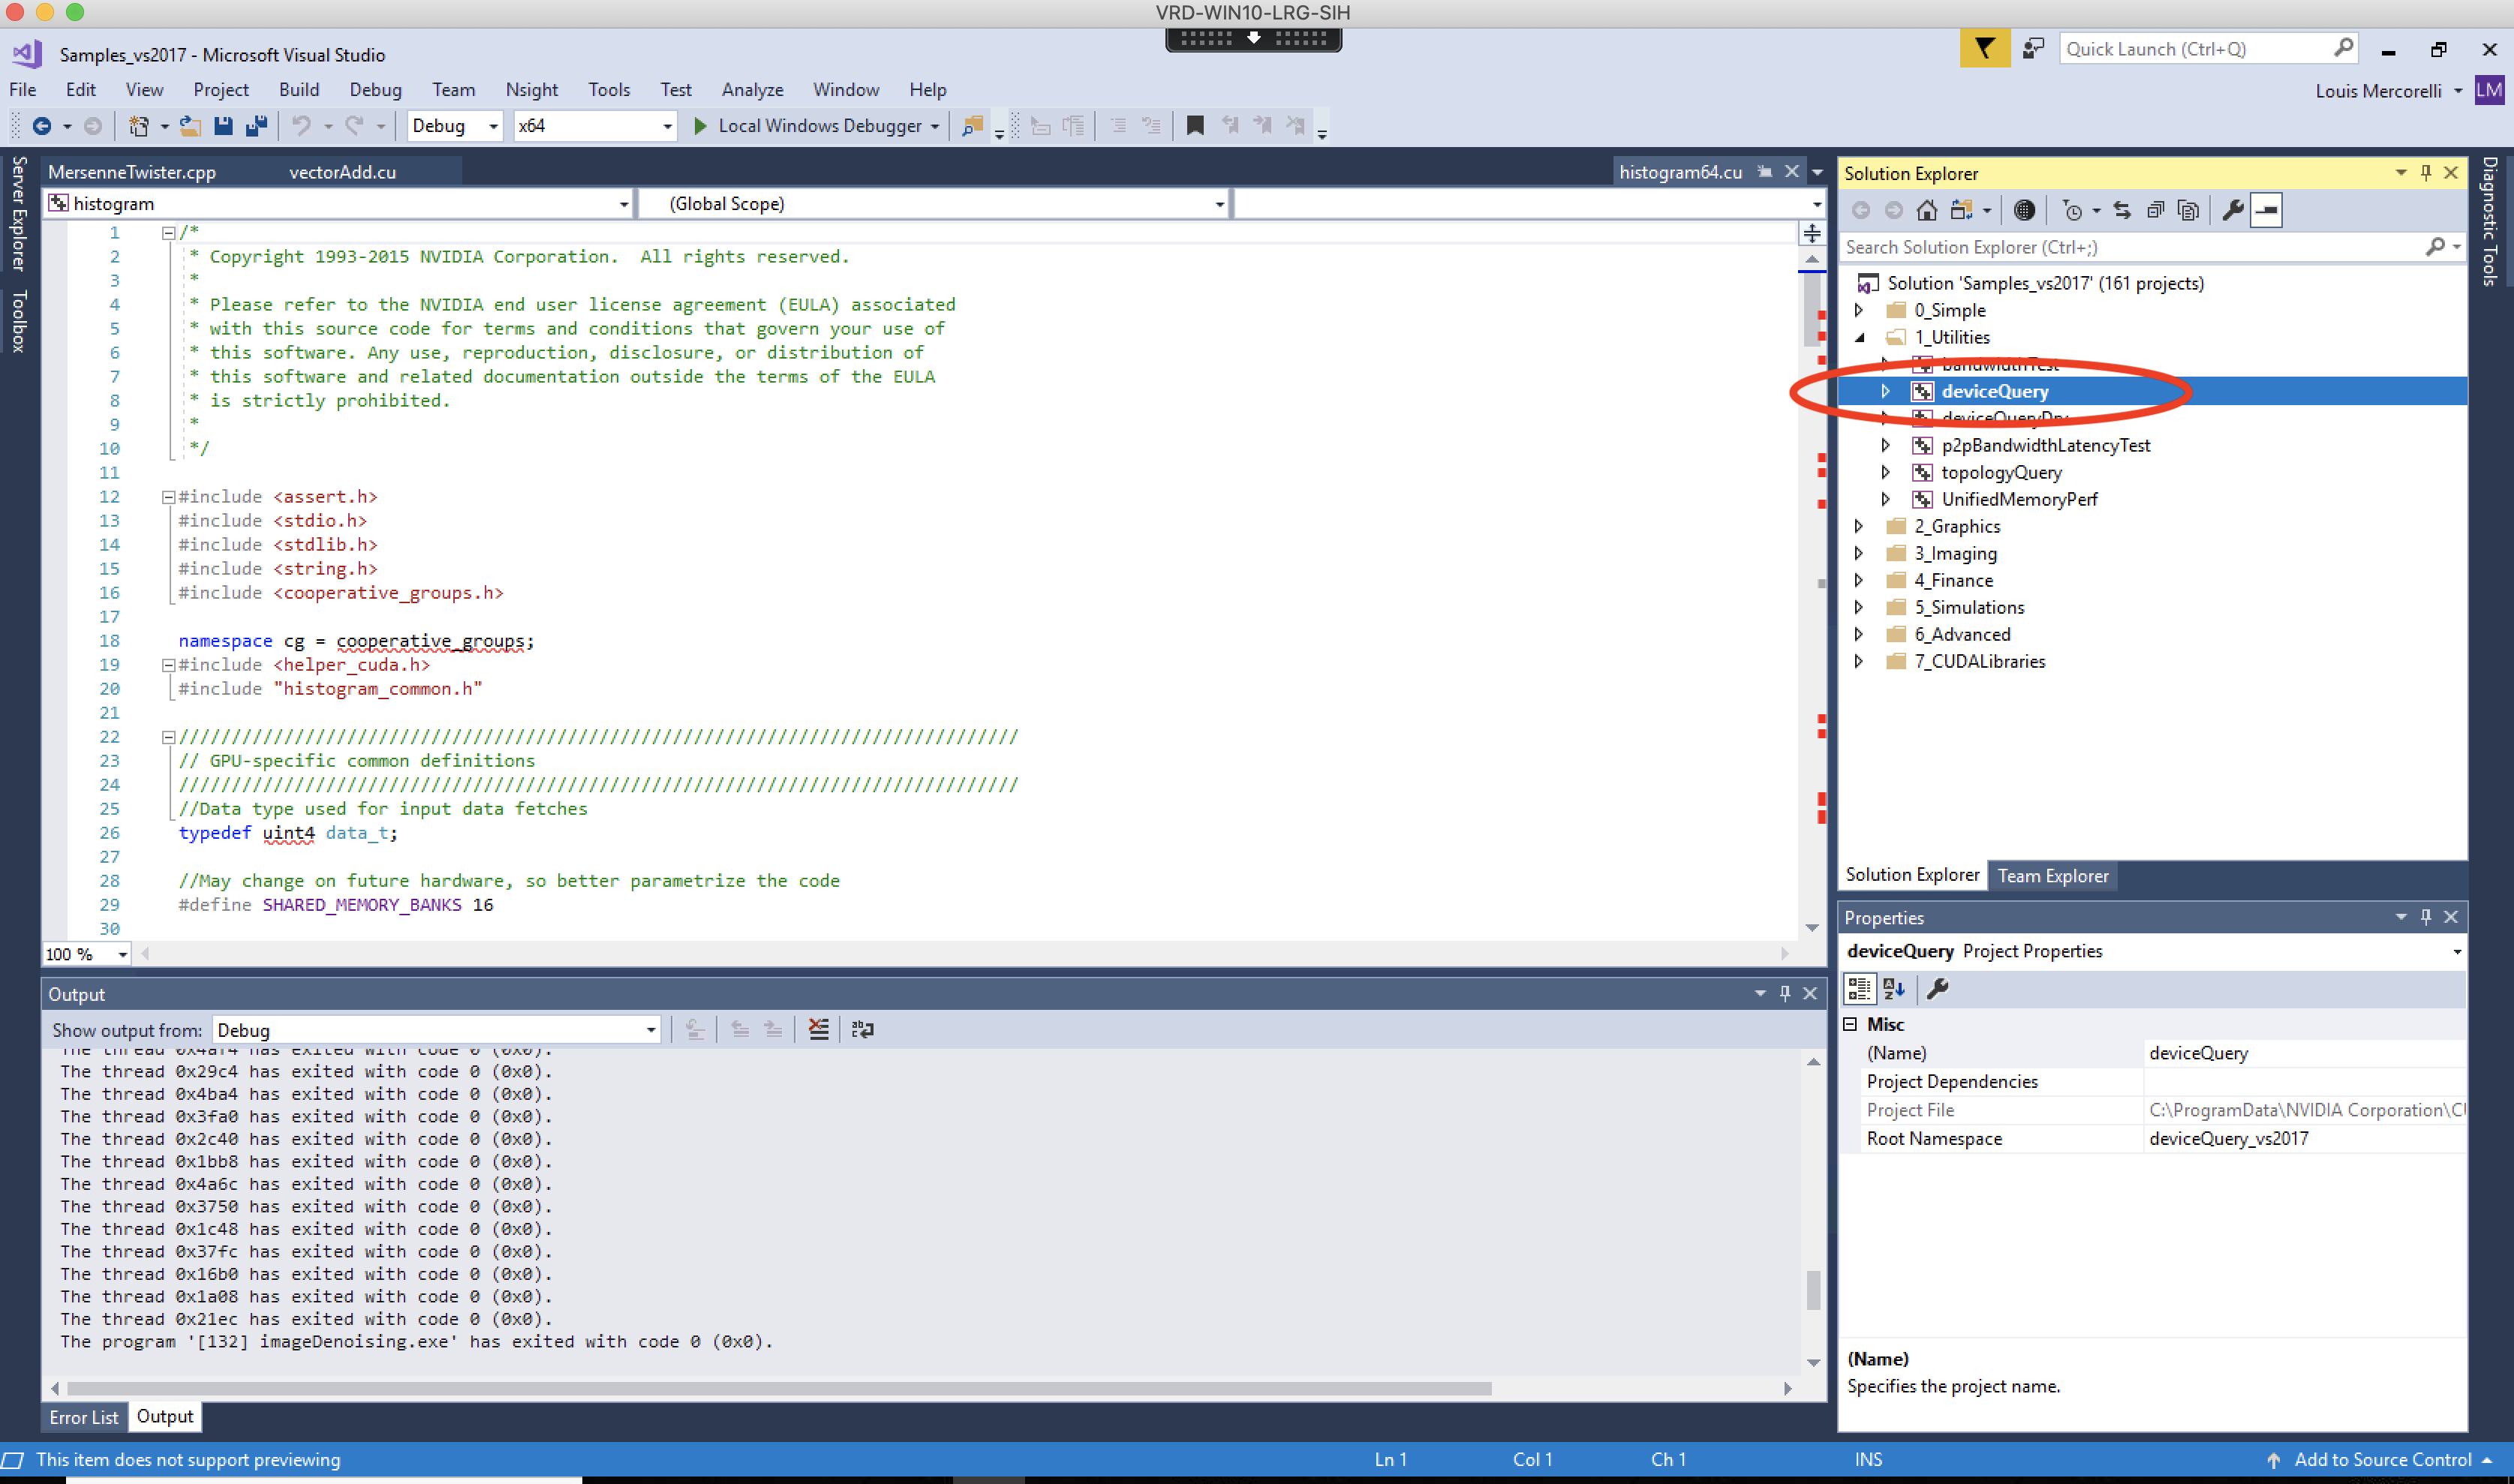
We now must choose the correct solution for Visual Studio on the Argus machine which is VS 2017. The last solution was created for VS 2017 so we will click on “Samples_vs2017.sln”. Now Visual Studio 2017 will start up with the sample CUDA programs pre-loaded. See the picture below.
Build/Compile for deviceQuery
There should be four windows open within VS 2017. The top left is the coding window, bottom left is the output window. The top right is the Solution Explorer and bottom right is the Properties window. To navigate to the “deviceQuery” project, start in the Solution Explorer window (top right) and expand the “1_Utilities” folder. The 2nd project should be “deviceQuery” project.
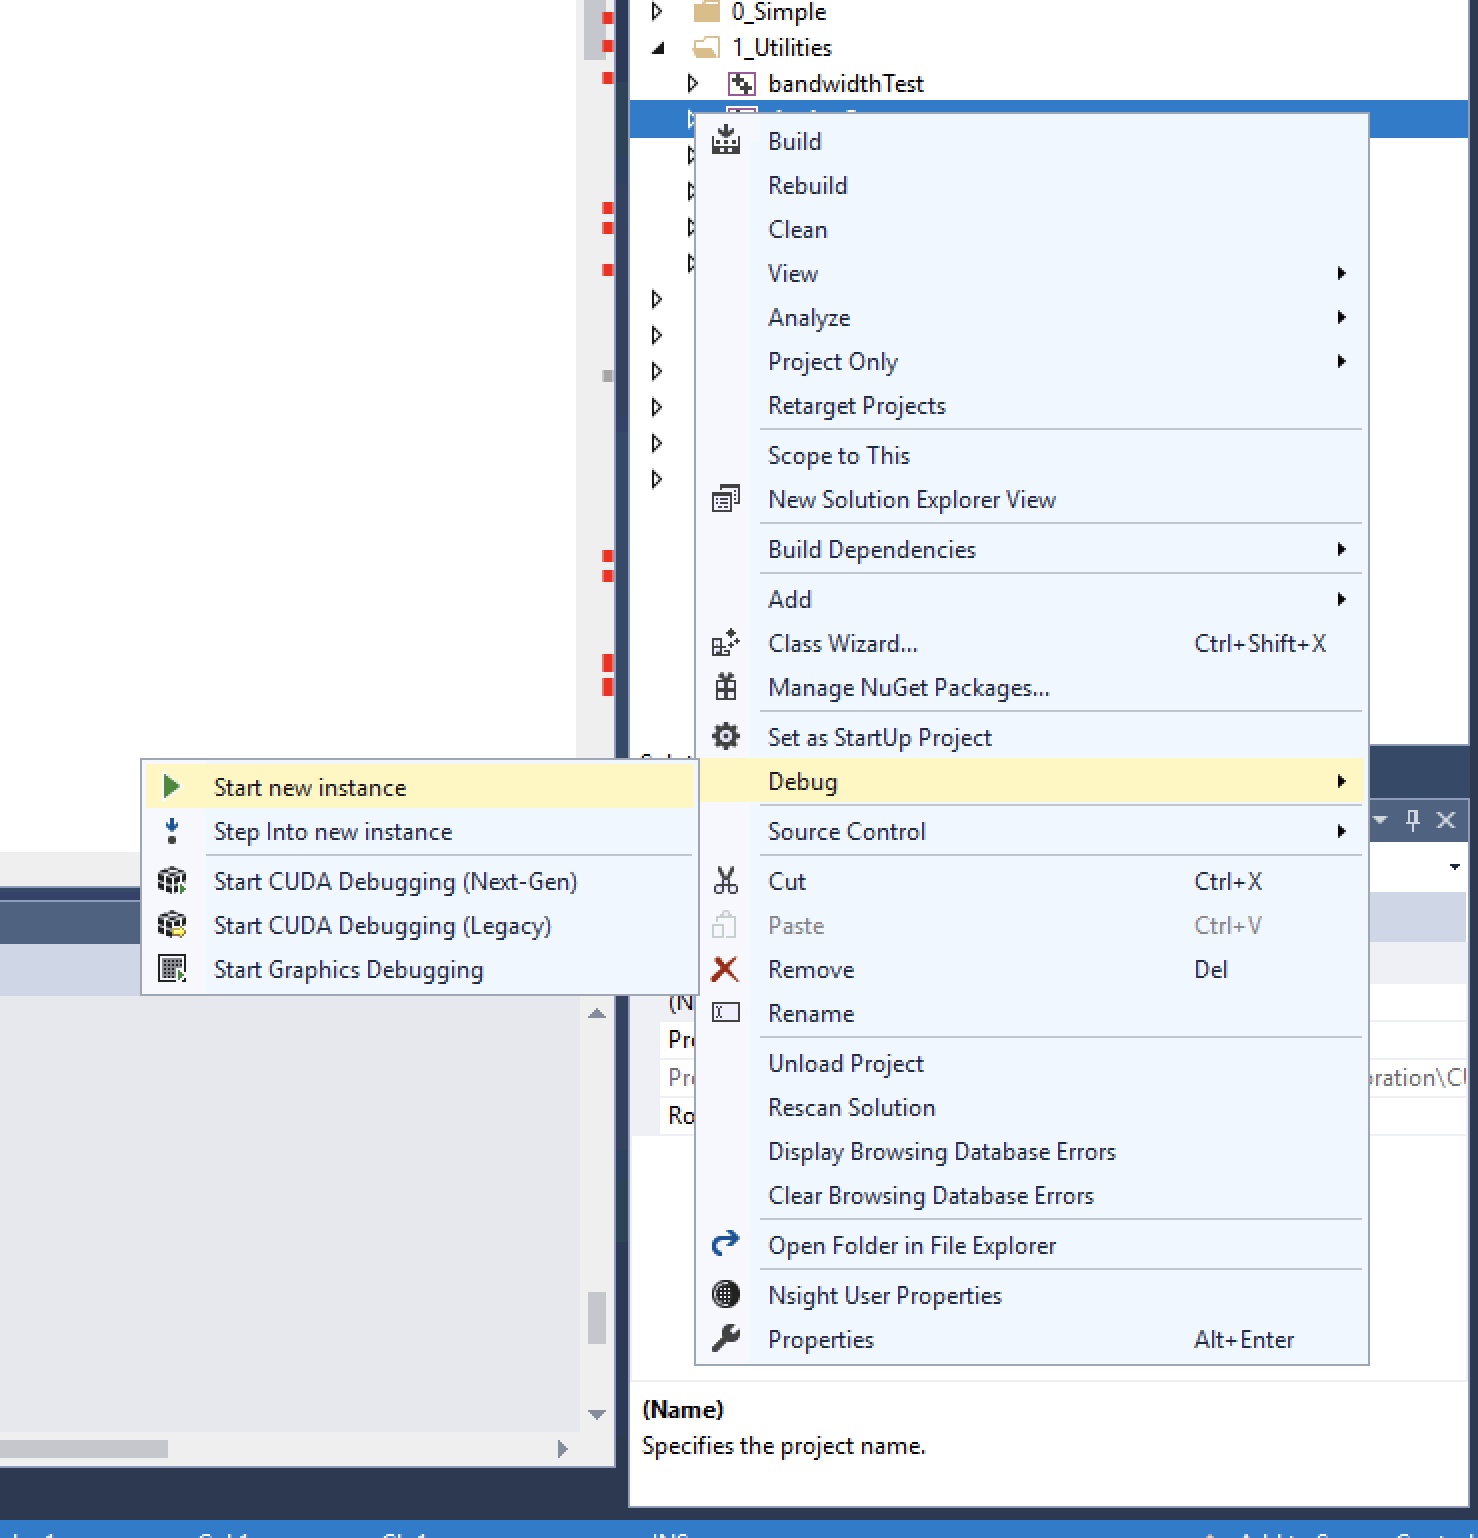
Once you find the “deviceQuery” project, “right-click” to get a list of options (see image below). NOTE if you do not see the same window as below try again and make sure your mouse is pointing directly on the “deviceQuery” project in the Solultion Explorer window.
Now you can build/compile the project by clicking on “Build” item which is at the very top of the list. Note that unlike R and Python which are interpreted languages, C++, C and CUDA are all compiled languages. and therefore must first be built/compiled.
When the build is completed successfully you should see the following message in the output window (bottom left),
”========== Build: 1 succeeded, 0 failed, 0 up-to-date, 0 skipped ==========”
Notice the successfully compile, indicated by the “1 succeeded” in the message above.
Run/Test
Now that you have built/compiled the program, you will want to run the module by right-clicking on the “deviceQuery” then choosing the “Debug” and then the “Start new instance” (see yellow highlights in the picture above). This will run the “deviceQuery” project from start to finish.
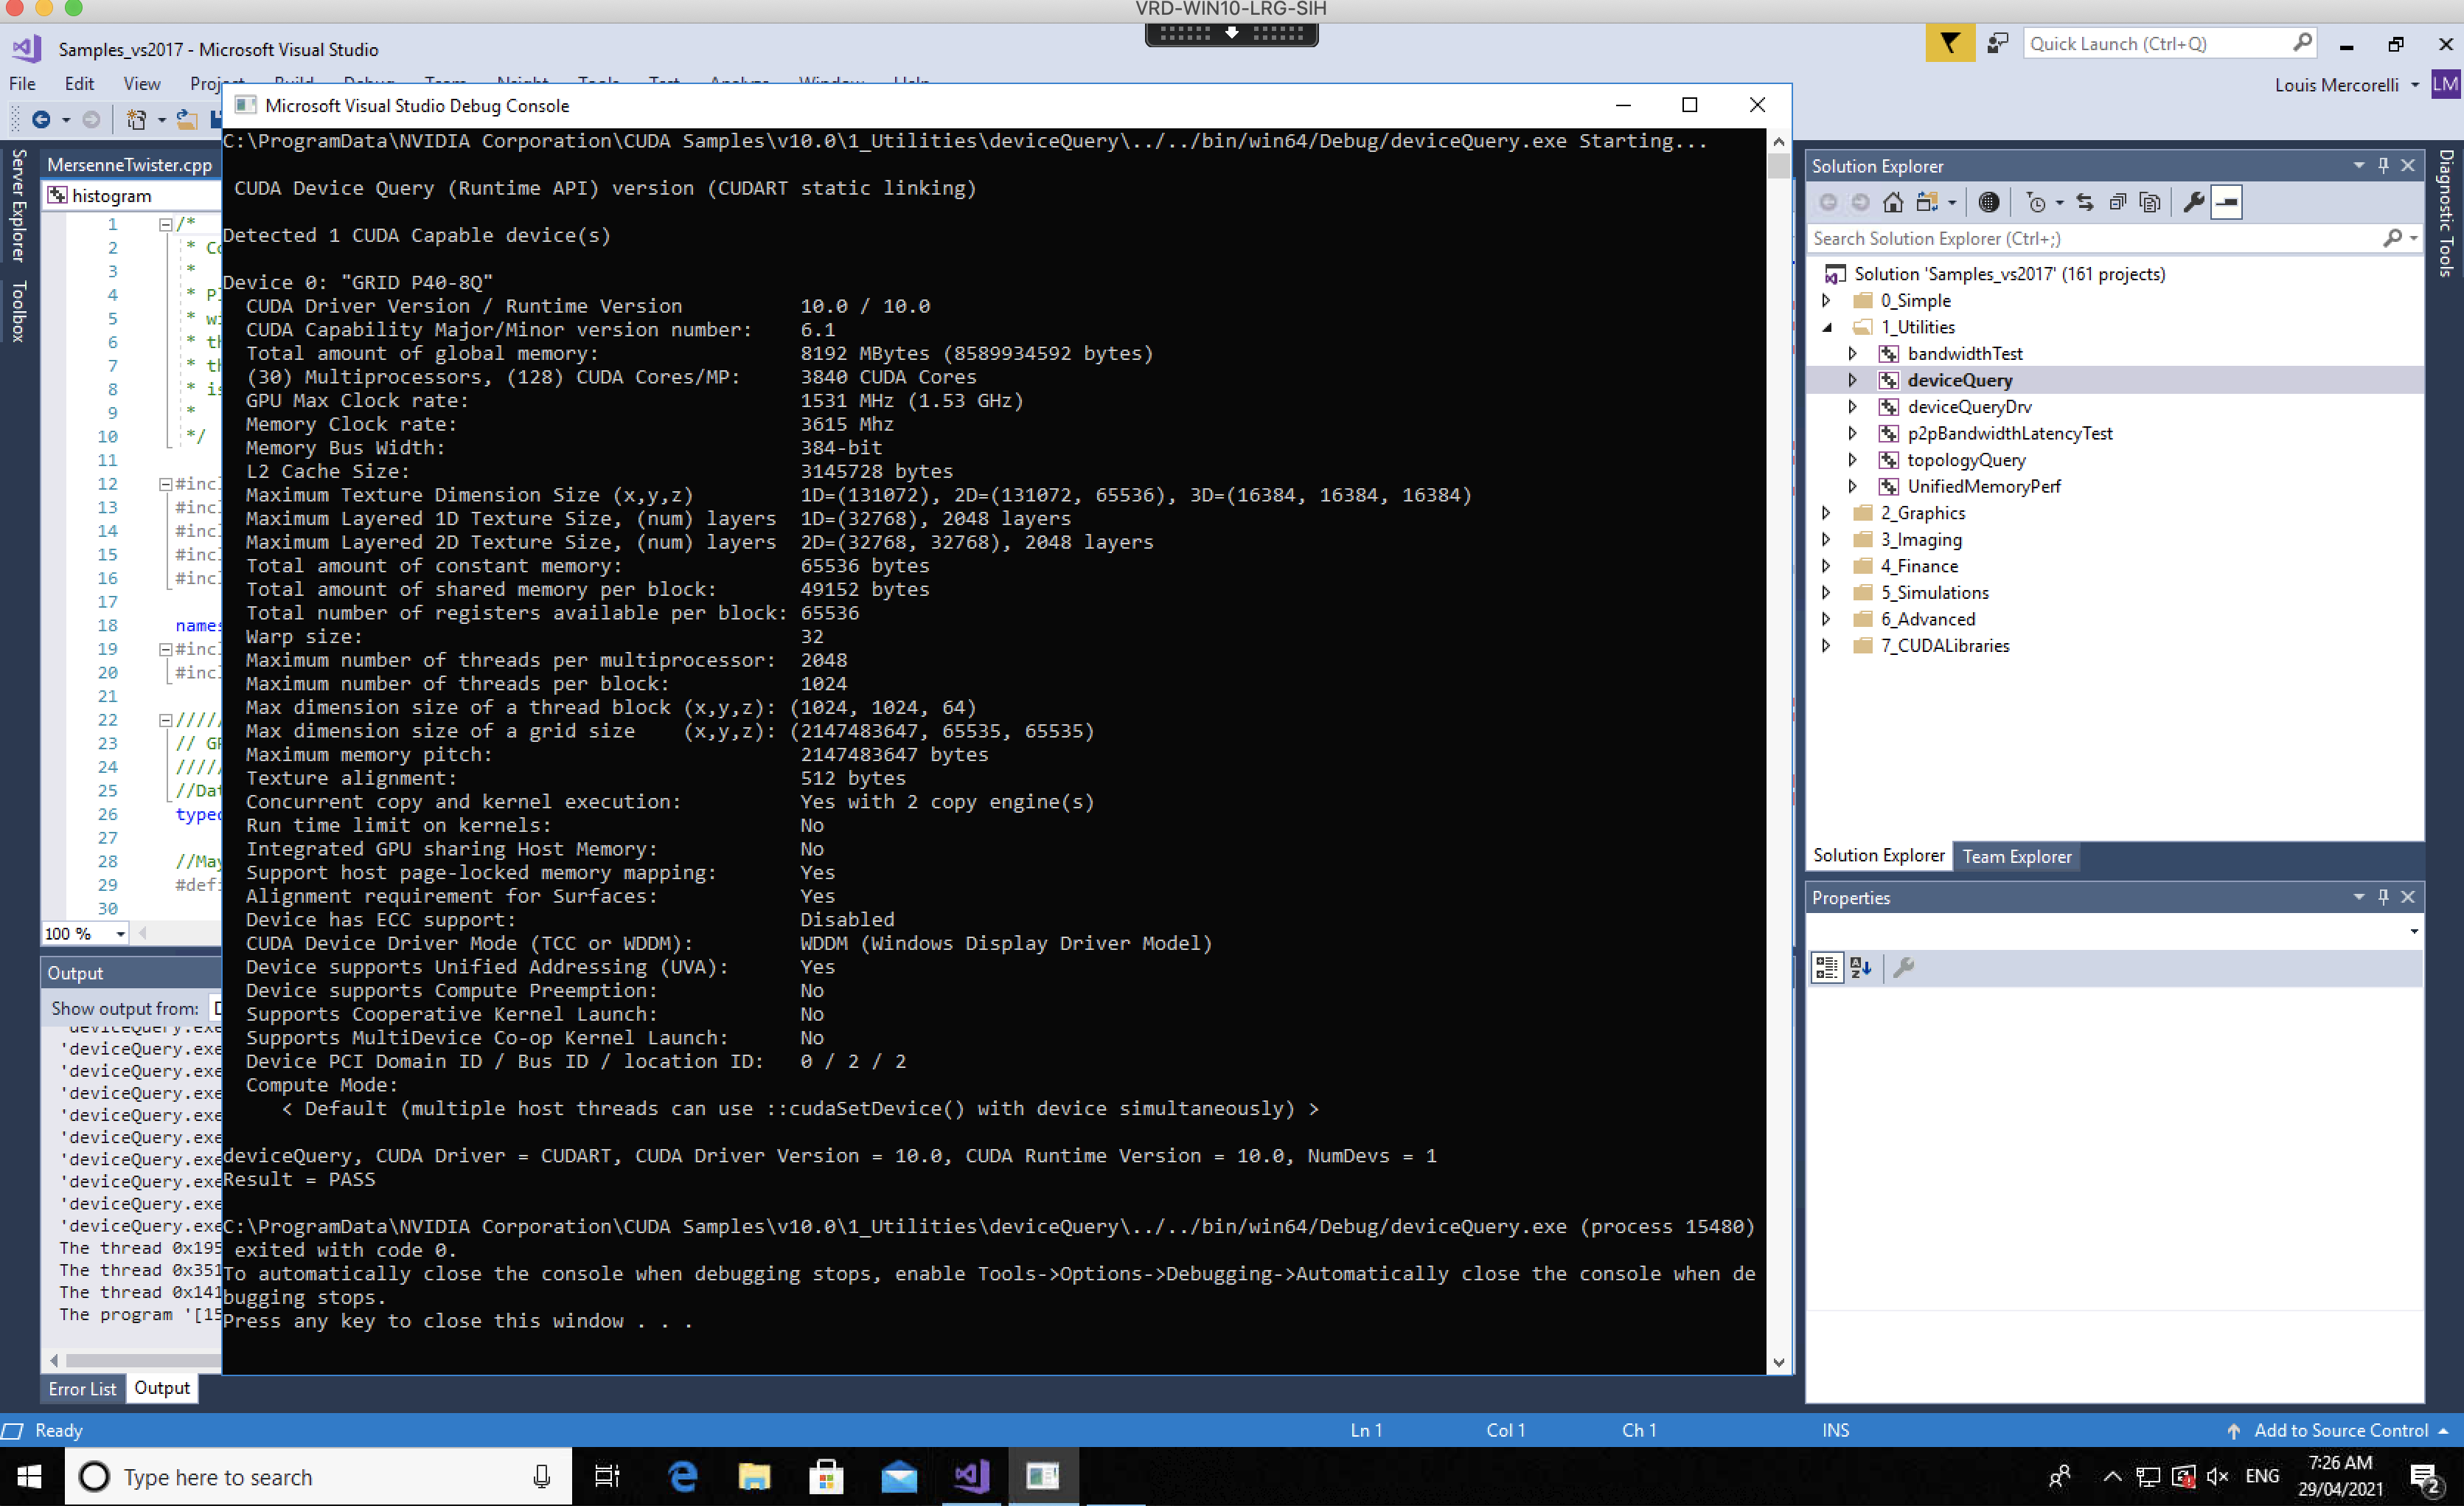
A window will pop up with the results which contain the specs for the GPU on the Argus machine (see below). Now let’s spend some time reviewing the specs for our GPU.
Many computers have only 8 CPU cores while high-end computers will have 64 CPU cores. Notice that there are 3840 CUDA Cores on the Argus machine! Imagine a CPU with that many cores! Also, notice that the 3840 CUDA cores only have 8Gb available while many computers can easily have 32Gb to 64Gb available to a far fewer number of cores.
This highlights the advantages and disadvantages of GPUs. Great for processing or compute intensive tasks but not so great for memory intensive tasks. For example, blockchains and cryptocurrencies generate many random numbers and test them to see if they meet certain criteria. These are heavy compute intensive tasks that require very little memory, great for GPUs.
C:\ProgramData\NVIDIA Corporation\CUDA Samples\v10.0\1_Utilities\deviceQuery\../../bin/win64/Debug/deviceQuery.exe Starting...

 CUDA Device Query (Runtime API) version (CUDART static linking)

Detected 1 CUDA Capable device(s)

Device 0: "GRID P40-8Q"
  CUDA Driver Version / Runtime Version          10.0 / 10.0
  CUDA Capability Major/Minor version number:    6.1
  Total amount of global memory:                 8192 MBytes (8589934592 bytes)
  (30) Multiprocessors, (128) CUDA Cores/MP:     3840 CUDA Cores
  GPU Max Clock rate:                            1531 MHz (1.53 GHz)
  Memory Clock rate:                             3615 Mhz
  Memory Bus Width:                              384-bit
  L2 Cache Size:                                 3145728 bytes
  Maximum Texture Dimension Size (x,y,z)         1D=(131072), 2D=(131072, 65536), 3D=(16384, 16384, 16384)
  Maximum Layered 1D Texture Size, (num) layers  1D=(32768), 2048 layers
  Maximum Layered 2D Texture Size, (num) layers  2D=(32768, 32768), 2048 layers
  Total amount of constant memory:               65536 bytes
  Total amount of shared memory per block:       49152 bytes
  Total number of registers available per block: 65536
  Warp size:                                     32
  Maximum number of threads per multiprocessor:  2048
  Maximum number of threads per block:           1024
  Max dimension size of a thread block (x,y,z): (1024, 1024, 64)
  Max dimension size of a grid size    (x,y,z): (2147483647, 65535, 65535)
  Maximum memory pitch:                          2147483647 bytes
  Texture alignment:                             512 bytes
  Concurrent copy and kernel execution:          Yes with 2 copy engine(s)
  Run time limit on kernels:                     No
  Integrated GPU sharing Host Memory:            No
  Support host page-locked memory mapping:       Yes
  Alignment requirement for Surfaces:            Yes
  Device has ECC support:                        Disabled
  CUDA Device Driver Mode (TCC or WDDM):         WDDM (Windows Display Driver Model)
  Device supports Unified Addressing (UVA):      Yes
  Device supports Compute Preemption:            No
  Supports Cooperative Kernel Launch:            No
  Supports MultiDevice Co-op Kernel Launch:      No
  Device PCI Domain ID / Bus ID / location ID:   0 / 2 / 2
  Compute Mode:
     < Default (multiple host threads can use ::cudaSetDevice() with device simultaneously) >

deviceQuery, CUDA Driver = CUDART, CUDA Driver Version = 10.0, CUDA Runtime Version = 10.0, NumDevs = 1
Result = PASS

C:\ProgramData\NVIDIA Corporation\CUDA Samples\v10.0\1_Utilities\deviceQuery\../../bin/win64/Debug/deviceQuery.exe (process 15480) exited with code 0.
To automatically close the console when debugging stops, enable Tools->Options->Debugging->Automatically close the console when debugging stops.
Press any key to close this window . . .
and here is a screen shot of the results as they would appear in Visual Studio.
IMPORTANT NOTE: the very last line says “Press any key to close the window…”, it should also say that if you don’t close this window you often can not run another solution. So make sure this window is closed BEFORE you attempt running the solution again or try running another solution.
Debug
Now we will do a little debugging using Visual Studio. To enter debugging mode, right click on the project “deviceQuery” and then click on “Debug” and finally click on “Step into new instance”. This will cause VS to start on the first available debug point in the “deviceQuery” code.
You can now use VS like any other IDE in debug mode by setting break points, checking variable values, setting variable watches, setting conditional break points and much more. For more detail on how to use VS debugger follow this link.
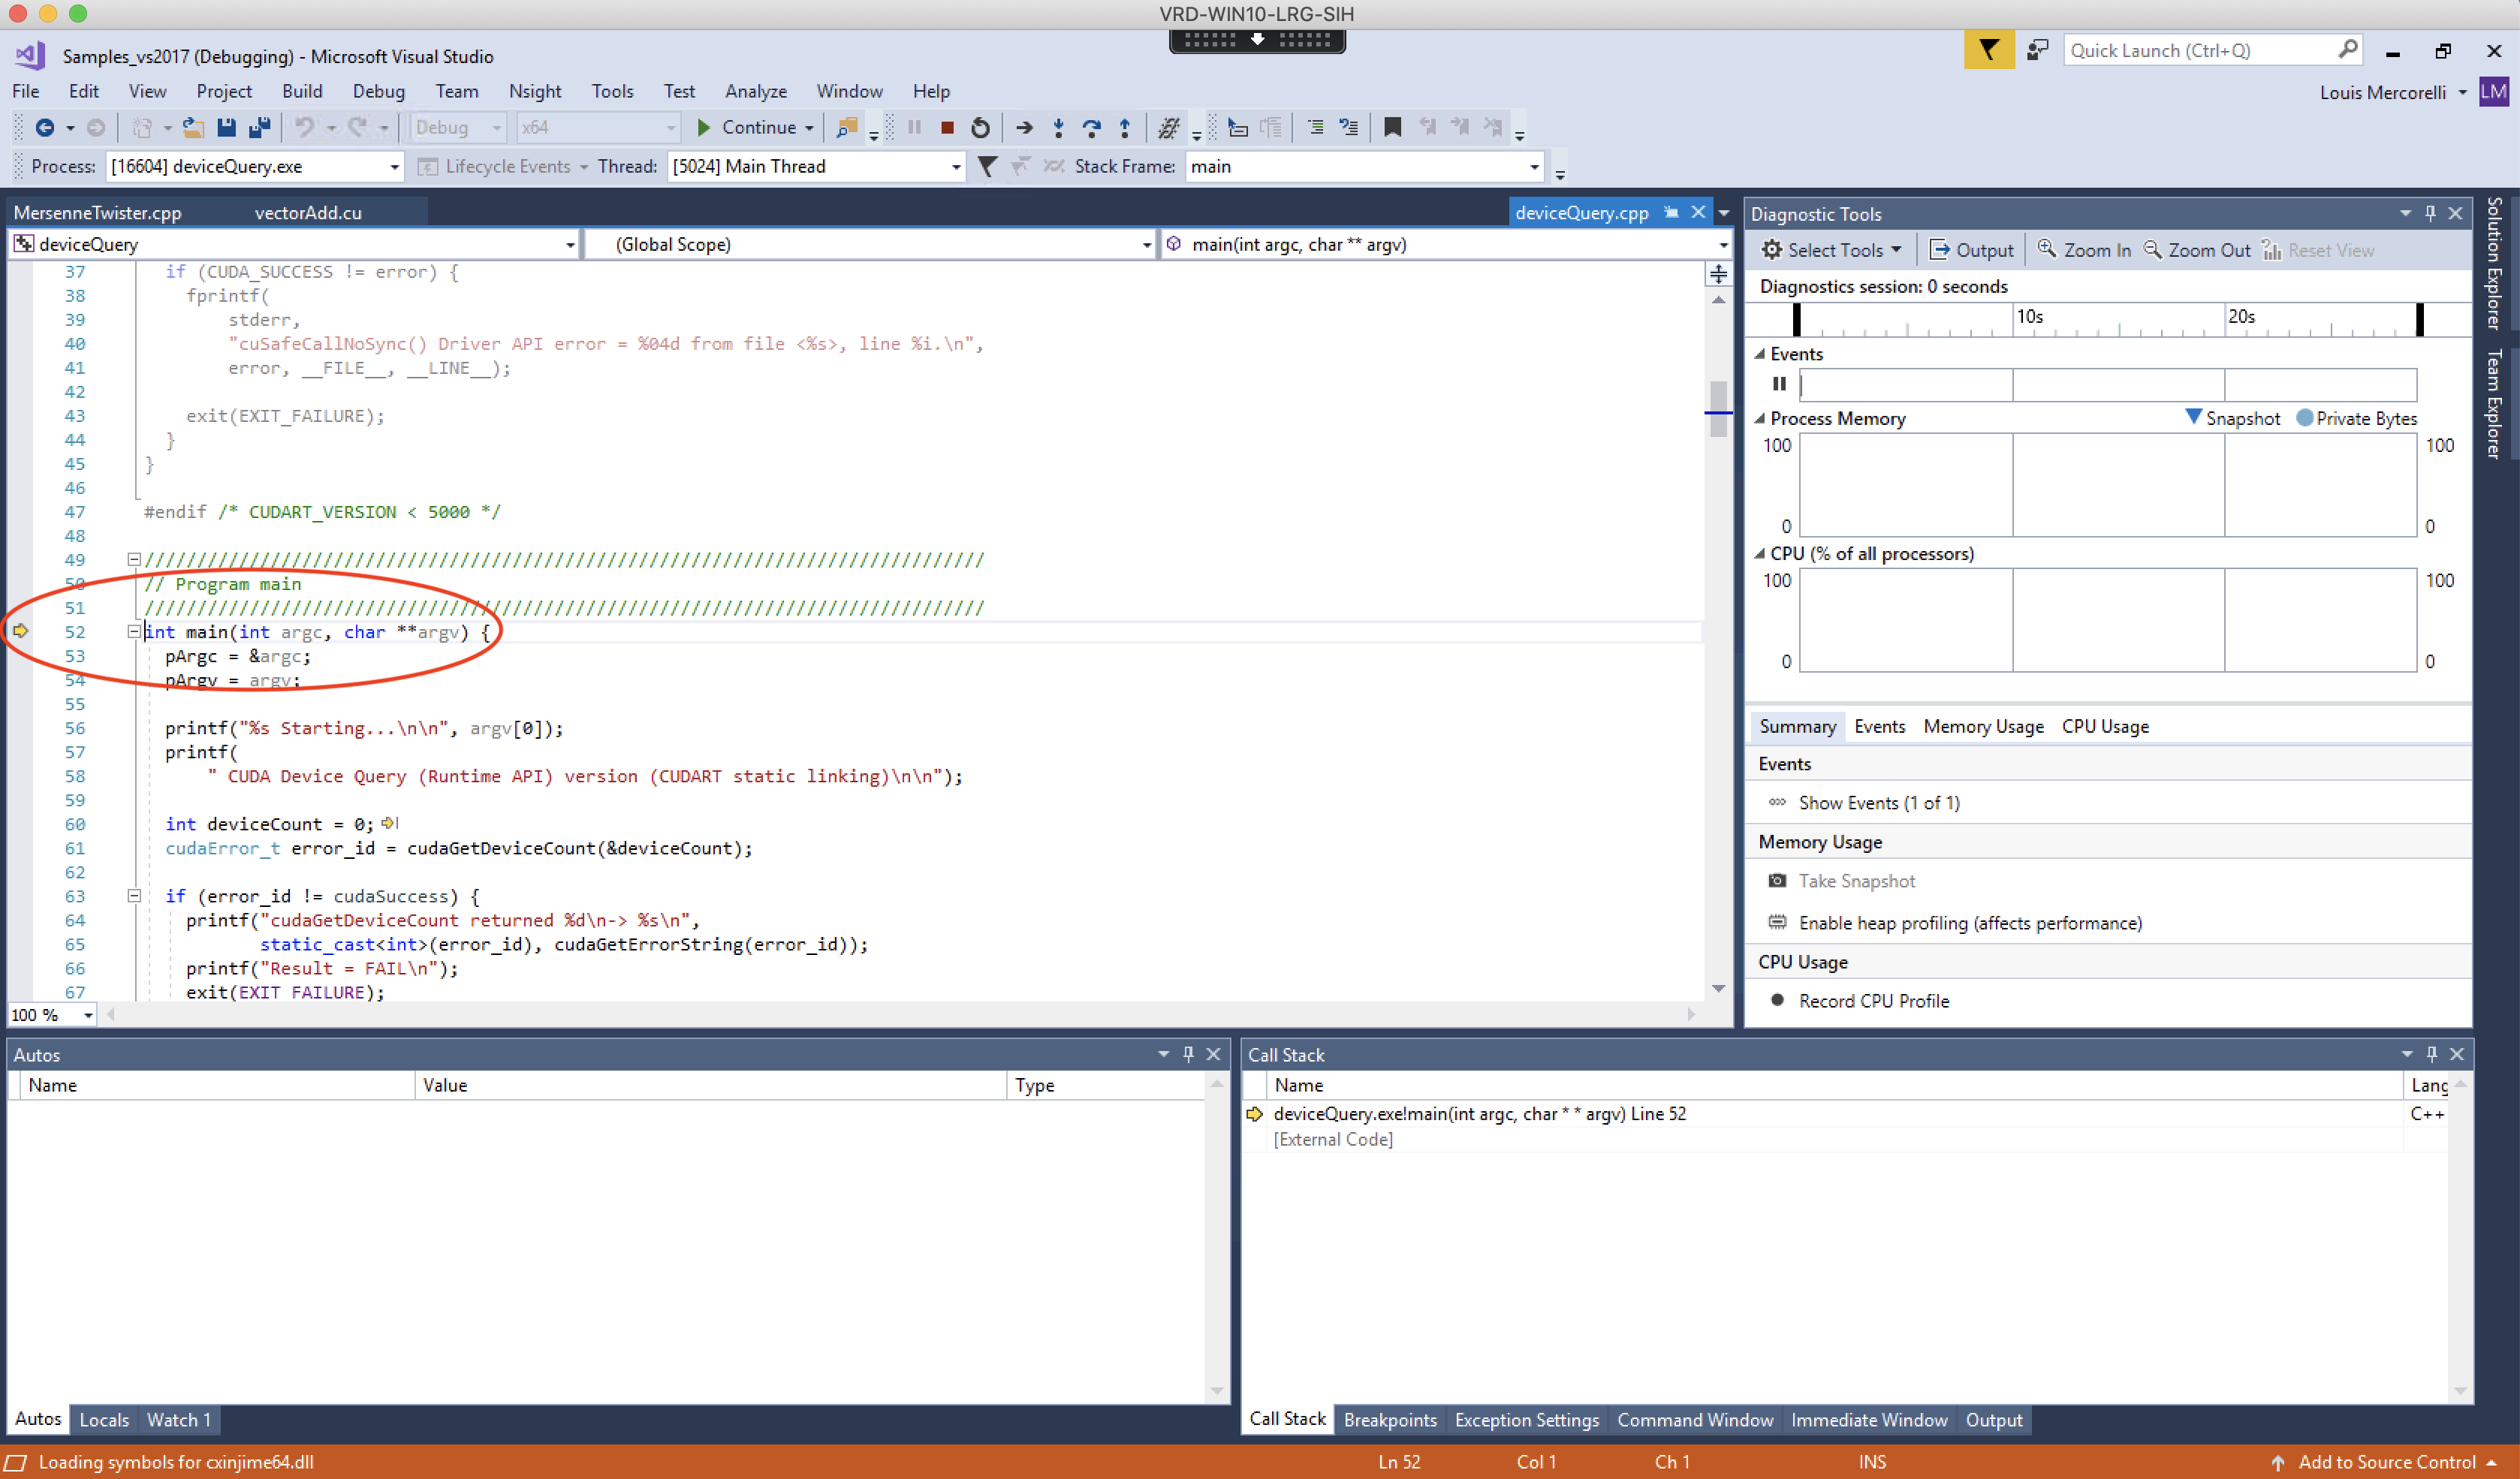
Feel free to place break points, run the code and check variable values. This method of debugging is great if your code is ever misbehaving (i.e. you have bugs or errors in the code).
Key Points
Basics of VS including build, run and debug
Finding out the specs for your GPU by running deviceQuery
Compiled vs Interpreted programming languages
GPU advantages and disadvantages