Functional enrichment analysis
Questions
- What is functional enrichment analysis?
- What are Gene Ontologies?
We now have a list of significant DE genes. To gain greater biological insights on the DE genes we can determine if there is enrichment of known biological functions, pathways or interactions.
There are different methods for identifying functional enrichments, e.g.:
- Over representation analysis (ORA). These databases typically categorize genes into groups based on shared function, involvement in a biological pathway, presence in a specific cellular location, or other categorizations, e.g. functional pathways, etc.
- Functional class scoring (FCS) e.g. Gene set enrichment analysis (GSEA).
- Enrichment analysis can be done using some of the freely available web- and R-based tools. Today we will use a R-package “clusterprofile” to perform Over representation analysis. You can read more about the GSEA method at https://www.gsea-msigdb.org/gsea/index.jsp
In this workshop, we will learn how to perform gene ontology enrichment analysis.
Over-representation analysis
There are a range of functional enrichment tools that perform some type of “over-representation” analysis by querying databases containing information about gene function and interactions. These databases typically categorize genes into groups based on shared function, or involvement in a pathway, or presence in a specific cellular location, or other categorizations, e.g. functional pathways, etc. Essentially, known genes are binned into categories that have been consistently named based on how the gene has been annotated functionally. These categories are independent of any organism, however each organism has distinct categories available.
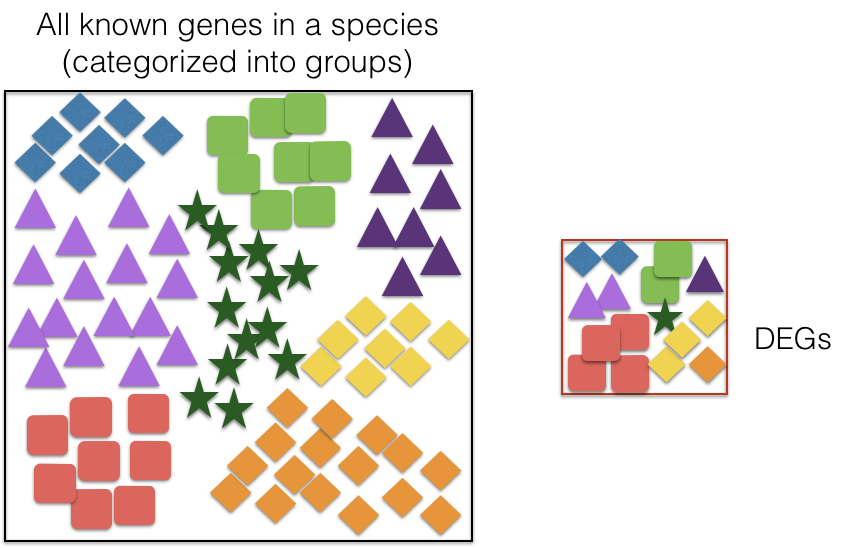
To determine whether any categories are over-represented, you can determine the probability of having the observed proportion of genes associated with a specific category in your gene list based on the proportion of genes associated with the same category in the background set (gene categorizations for the appropriate organism).
Gene Ontologies
One of the most widely-used categorizations is Gene Ontology (GO) established by the Gene Ontology project. To describe the functional roles of genes and gene products, they are categorized into GO terms. GO terms are organized into three independent controlled vocabularies (ontologies) in a species-independent manner:
- Biological process: Refers to the biological role involving the gene or gene product, and could include “transcription”, “signal transduction”, and “apoptosis”. A biological process generally involves a chemical or physical change of the starting material or input.
- Molecular function: Represents the biochemical activity of the gene product, such activities could include “ligand”, “GTPase”, and “transporter”.
- Cellular component: Refers to the location in the cell of the gene product. Cellular components could include “nucleus”, “lysosome”, and “plasma membrane”.
GO enrichment analysis tools will determine GO terms that are enriched when you supply it will a list of DE genes.
clusterProfiler
The clusterProfiler package implements methods to analyze and visualize functional profiles of genes. The clusterProfiler R-library supports functional characteristics of both coding and non-coding genomics data for thousands of species with up-to-date gene annotation. It provides a tidy interface to access, manipulate, and visualize enrichment results to help users achieve efficient data interpretation.
Prepare the DE gene results for enrichment analysis
We will use clusterProfiler to perform enrichment analysis for upregulated and downregulated significant DE genes separately. We can use the resSig005_subset_lfc dataframe created earlier and prepare the data for clusterProfiler.
# We will use the resSig005_subset_lfc dataframe created earlier
# This has been filtered for padj < 0.05 and |LFC| > 1 DE genes

# Upregulated genes
# Filter for significant upregulated genes by log2 fold change > 1. Remove NAs.
sig.up <- resSig005_subset_lfc[resSig005_subset_lfc$log2FoldChange > 1, ]
sig.up <- na.omit(sig.up)
# Create list by decreasing log fold change for upregulated genes
sig.up.LFC <- sig.up$log2FoldChange
names(sig.up.LFC) <- rownames(sig.up)
# Sort by LFC, decreasing
sig.up.LFC <- sort(sig.up.LFC, decreasing = TRUE)

# Downregulated genes - let's do the same thing
sig.dn <- resSig005_subset_lfc[resSig005_subset_lfc$log2FoldChange < -1, ]
# Filter for significant upregulated genes by log2 fold change < -1. Remove NAs.
sig.dn <- na.omit(sig.dn)
# Create list by decreasing log fold change for upregulated genes
sig.dn.LFC <- sig.dn$log2FoldChange
names(sig.dn.LFC) <- rownames(sig.dn)
# Sort by LFC, decreasing
sig.dn.LFC <- sort(sig.dn.LFC, decreasing = TRUE)
You can check that you have correctly prepared the data by inspecting sig.up.LFC and sig.dn.LFC in the console. Use class() to check what type of R class we have stored the data in.
GO enrichment of upregulated genes
Clusterprofiler implements the function enrichGO() for gene ontology over-representation test. Let’s run the analysis for up-regulated genes. You can check what the different parameters in the function do by running the command ?enrichGO. The command will take a few minutes to run.
ego.up <- enrichGO(gene = names(sig.up.LFC),
                   OrgDb = org.Mm.eg.db,
                   keyType = 'SYMBOL',
                   readable = FALSE,
                   ont = "ALL",
                   pAdjustMethod = "BH",
                   pvalueCutoff = 0.05,
                   qvalueCutoff = 0.05)
Bar plot of upregulated enriched GO terms
The bar plot is a commonly used method to visualize enriched terms. It depicts the enrichment scores (e.g. p-adj values) and gene count or ratio as bar height and colour.
barplot(ego.up,
        showCategory = 20)
Dot plot of upregulated enriched GO terms
A dot plot is similar to a scatter plot and bar plot with the capability to encode another score as dot size. In R the dot plot displays the index (each category) in the vertical axis and the corresponding value in the horizontal axis, so you can see the value of each observation following a horizontal line from the label.
dotplot(ego.up,
        showCategory = 20,
        font.size = 8)
cnetplot of upregulated enriched GO terms
Both the barplot and dotplot only displayed most significant enriched terms, while users may want to know which genes are involved in these significant terms. The cnetplot depicts the linkages of genes and biological concepts (e.g. GO terms or KEGG pathways) as a network.
cnetplot(ego.up,
         categorySize = "pvalue",
         foldChange = sig.up.LFC,
         cex_label_gene = 0.7,
         showCategory = 5,
         cex_label_category = 1.2,
         shadowtext = 'category')
Heatmap-like functional classification of upregulated enriched GO terms
The heatplot is similar to cnetplot, while displaying the relationships as a heatmap. The gene-concept network may become too complicated if user want to show a large number significant terms. The heatplot can simplify the result and more easy to identify expression patterns.
heatplot(ego.up,
         showCategory = 20,
         foldChange = sig.up.LFC)
GO enrichment of downregulated genes
A breakout room task: Try re-doing the above steps for downregulated genes. Please remember to rename the variable differently so as to not over-write them e.g. ego.dn in place of ego.up etc…*
This will be a good time to familiarise yourself with the various functions you have used. Remember, you can try and run ?Function_NAME e.g. ?enrichGO to get the help manual pages for that function. You can play with pvalue and qvalue cutoffs, categories etc. Try and interpret the results. We will discuss them at the end of this session.
ego.dn <- enrichGO(gene = names(sig.dn.LFC),
                   OrgDb = org.Mm.eg.db,
                   keyType = 'SYMBOL',
                   readable = FALSE,
                   ont = "ALL",
                   pAdjustMethod = "BH",
                   pvalueCutoff = 0.05,
                   qvalueCutoff = 0.05??q)
Bar plot of downregulated enriched GO terms
barplot(ego.dn,
        showCategory = 20)
Dot-plot of downregulated enriched GO terms
dotplot(ego.dn,
        showCategory = 20,
        font.size = 10)
cnetplot of downregulated enriched GO terms
cnetplot(ego.dn,
         categorySize = "pvalue",
         foldChange = sig.dn.LFC,
         cex_label_gene = 0.7,
         showCategory = 5,
         cex_label_category = 1.5,
         shadowtext = 'category')
Heatmap-like functional classification of downregulated enriched GO terms
heatplot(ego.dn,
         showCategory = 20,
         foldChange = sig.dn.LFC)
Other enrich functions in clusterprofiler
clustrprofiler has other functions
- enrichKEGG KEGG
- enrichWP WikiPathways
- enrichPathway Reactome
- enrichr Enrichr resource
Other resources for enrichment analysis
Open source options
- Pantherdb http://pantherdb.org/
- Enrichr https://maayanlab.cloud/Enrichr/
- David https://david.ncifcrf.gov/
- gprofiler https://biit.cs.ut.ee/gprofiler/ And many more …
Commercial options
- Ingenuity Pathway Analysis (IPA) https://www.qiagen.com/us/
- Metacore https://portal.genego.com/
sessionInfo()
It is good practice to record the version of R and all tools you are using for reproducibility purposes (and for the methods section in your paper!). R’s sessionInfo() prints all of this information.
sessionInfo()Key points
- Functional enrichments can guide our intepretation of results in their biological context.
- Functional enrichments can include pathways and gene ontologies
All materials copyright Sydney Informatics Hub, University of Sydney