How to Use the Dashboards
Overview
This dashboard view provides holistic infrastructure information useful for both researchers and system administrators in managing and planning the resources.
Indicators
This section presents high-level statistics of the GPU computing resources 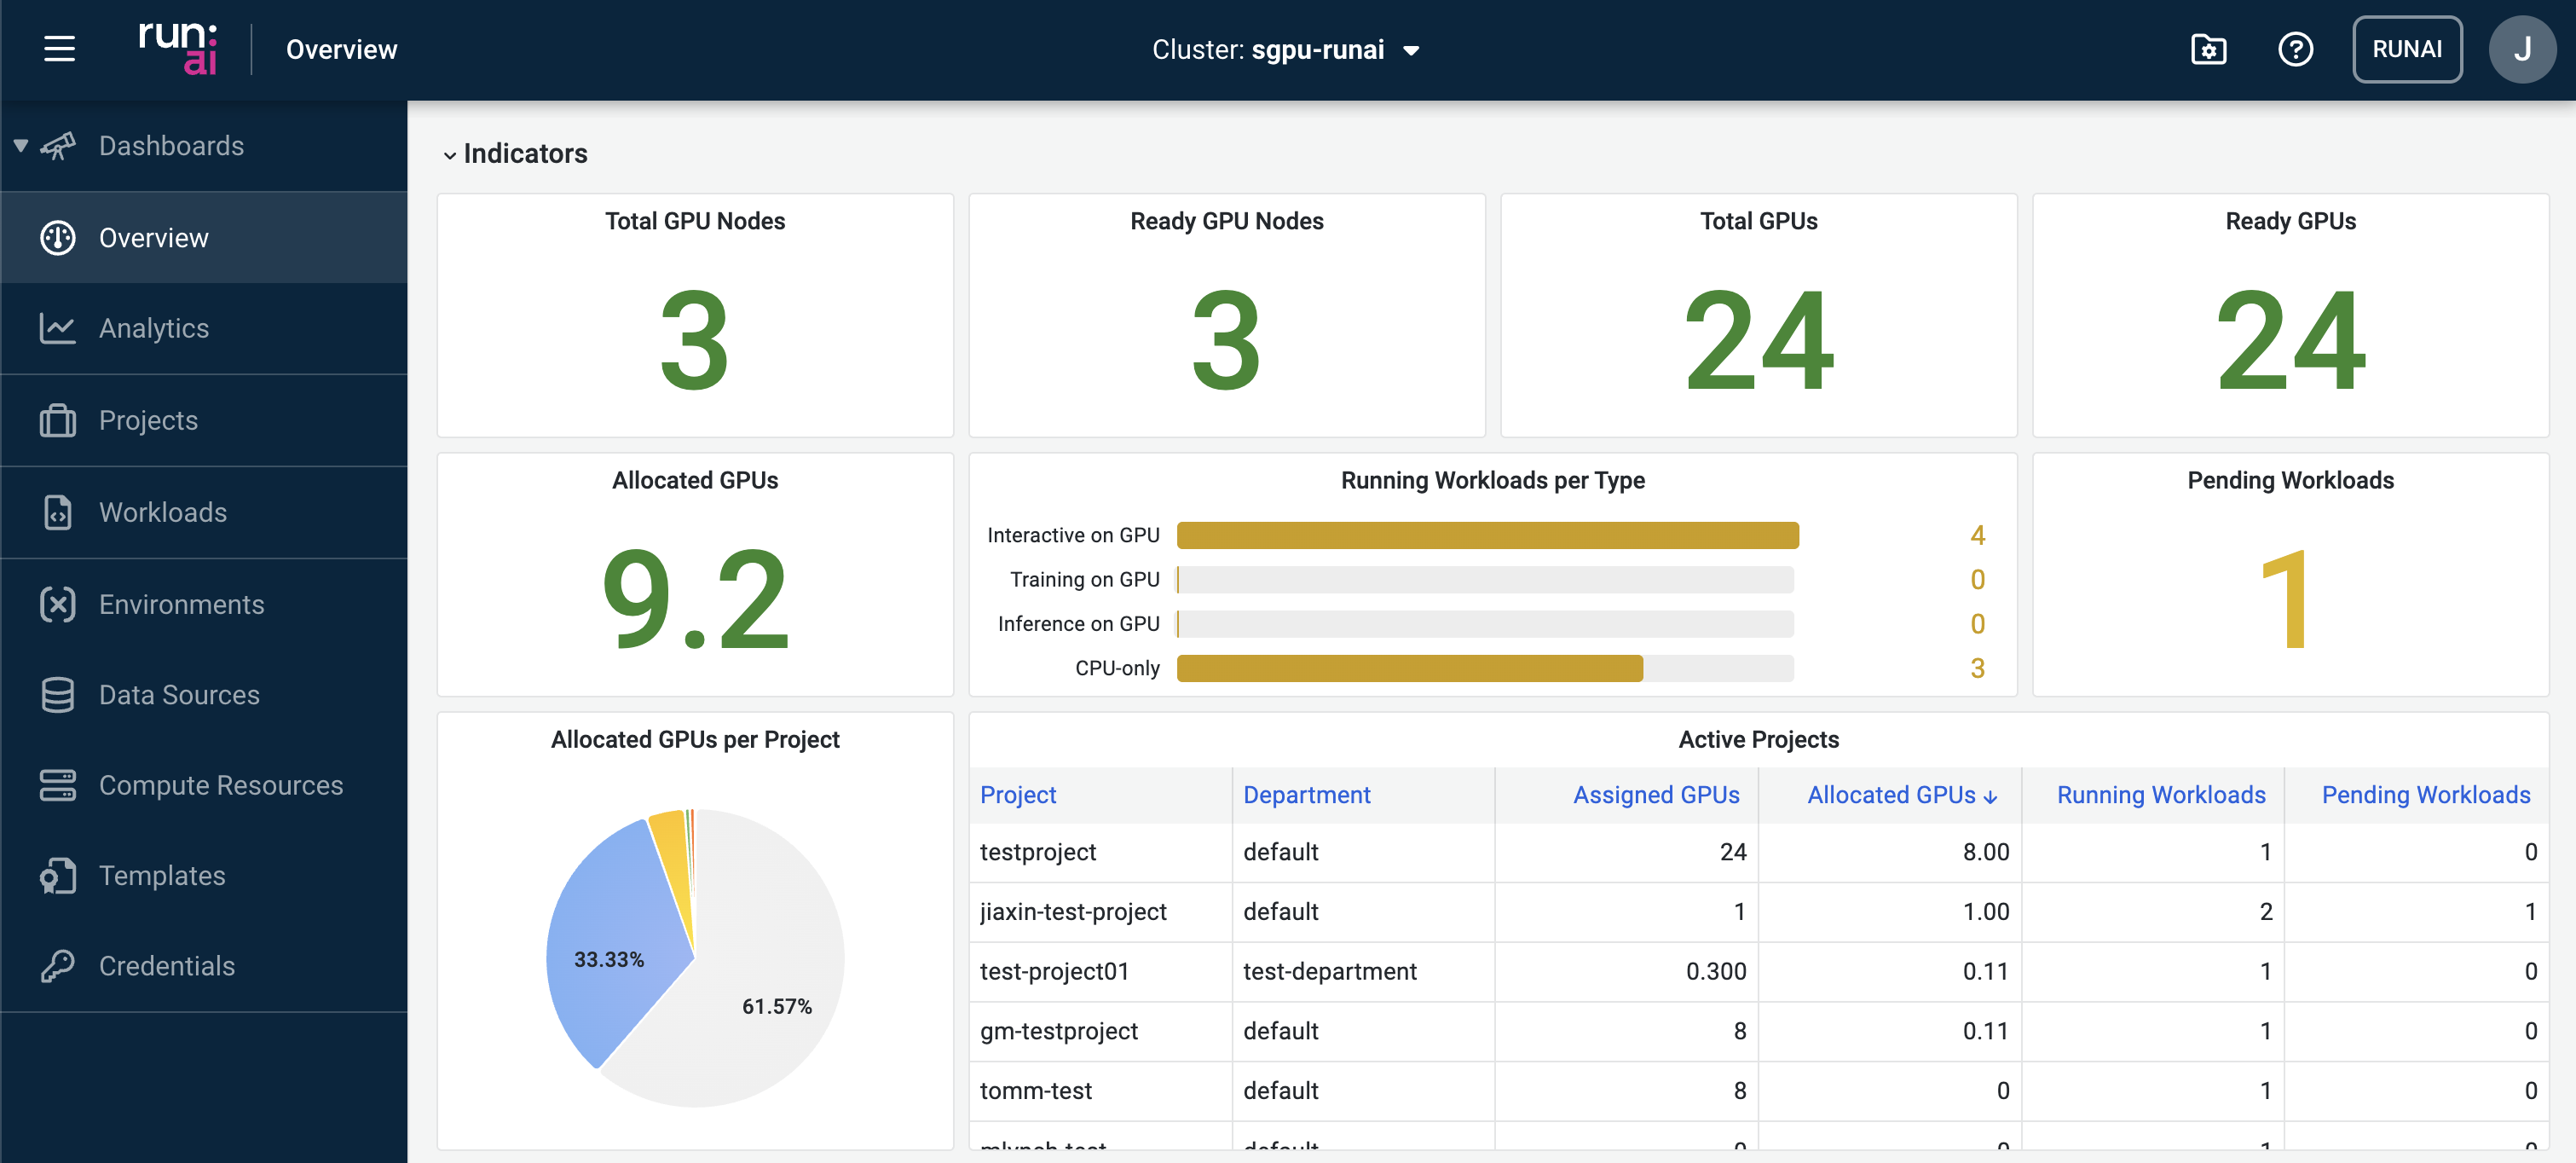
Cluster Load
Real-time monitoring of the cluster status in terms of GPU and CPU utilisation. 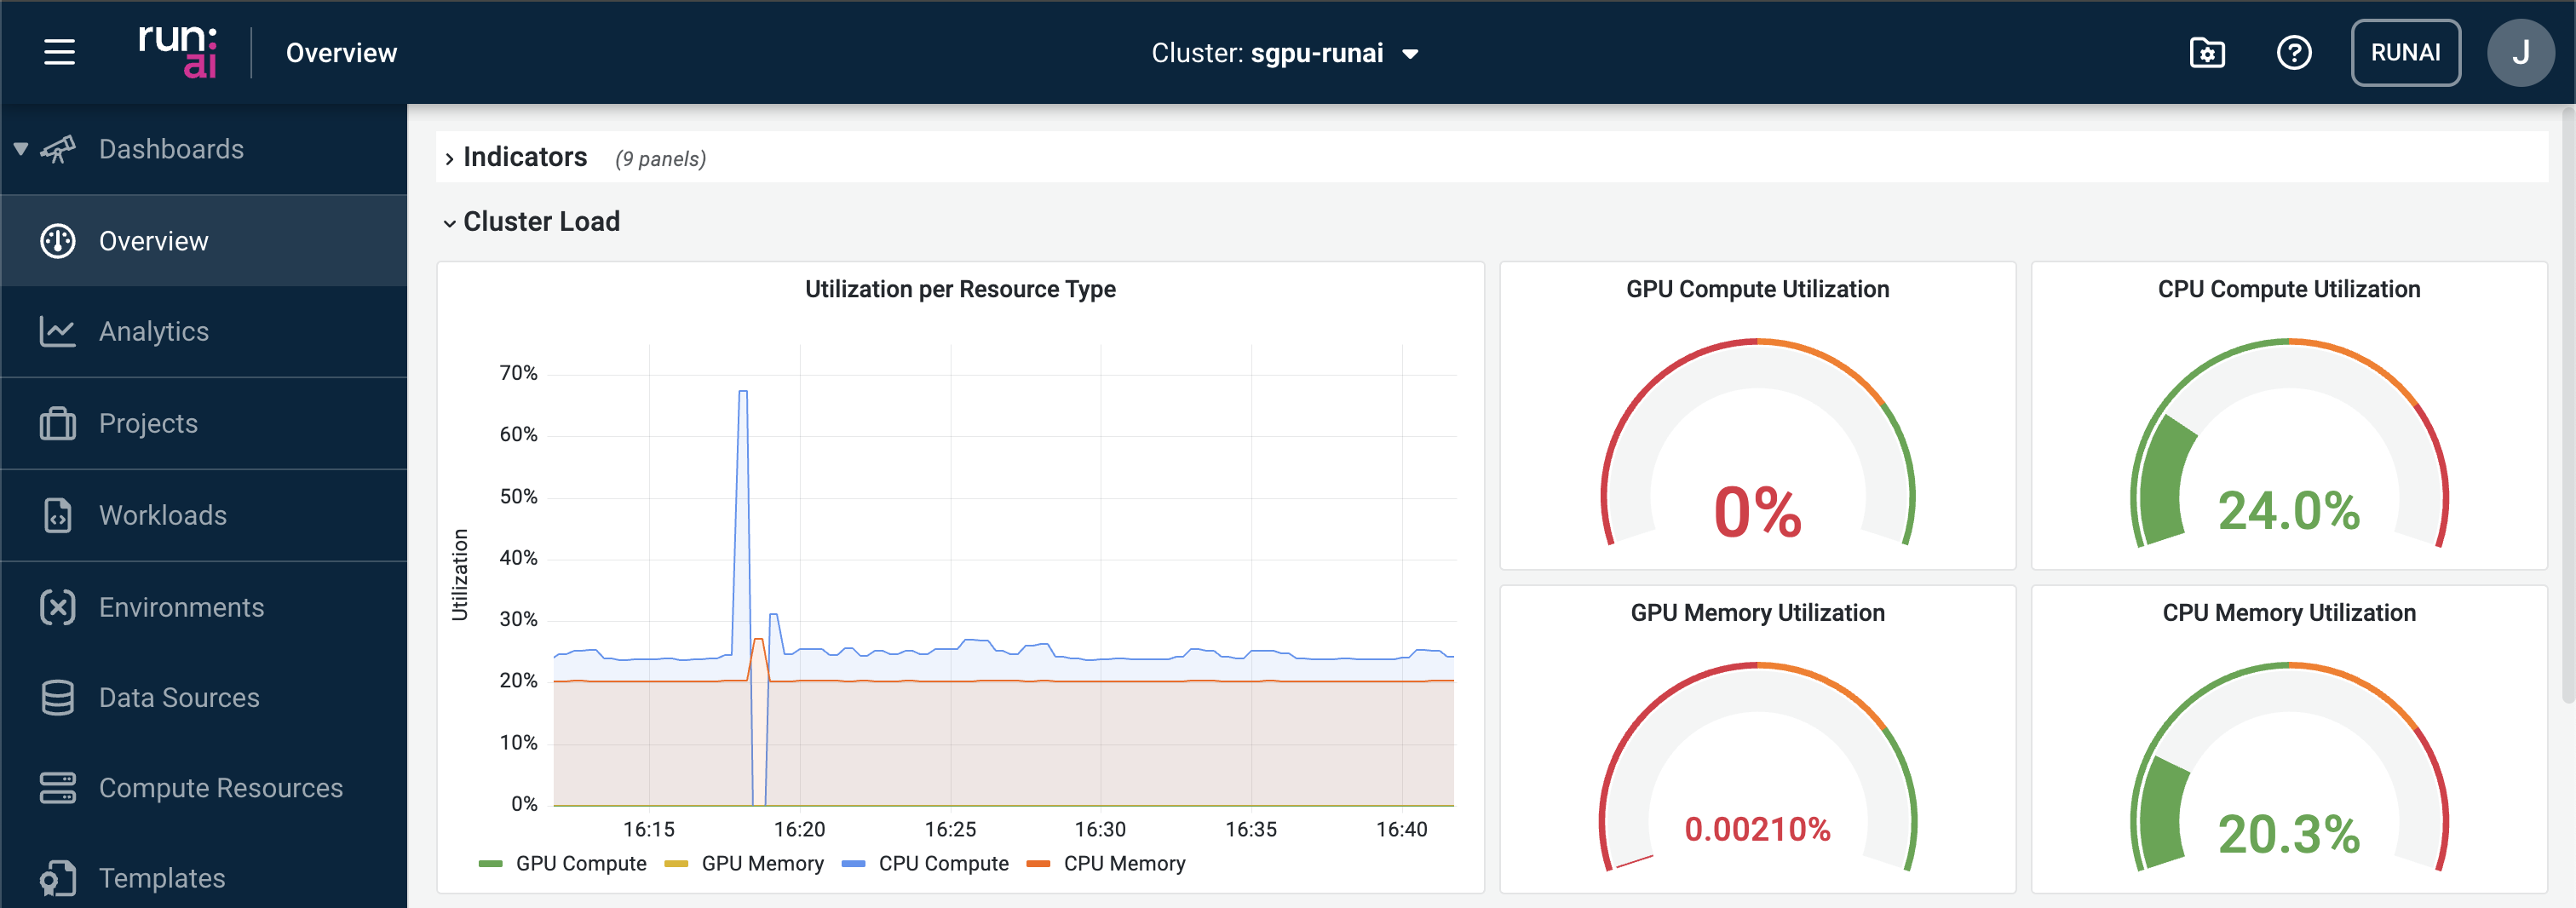
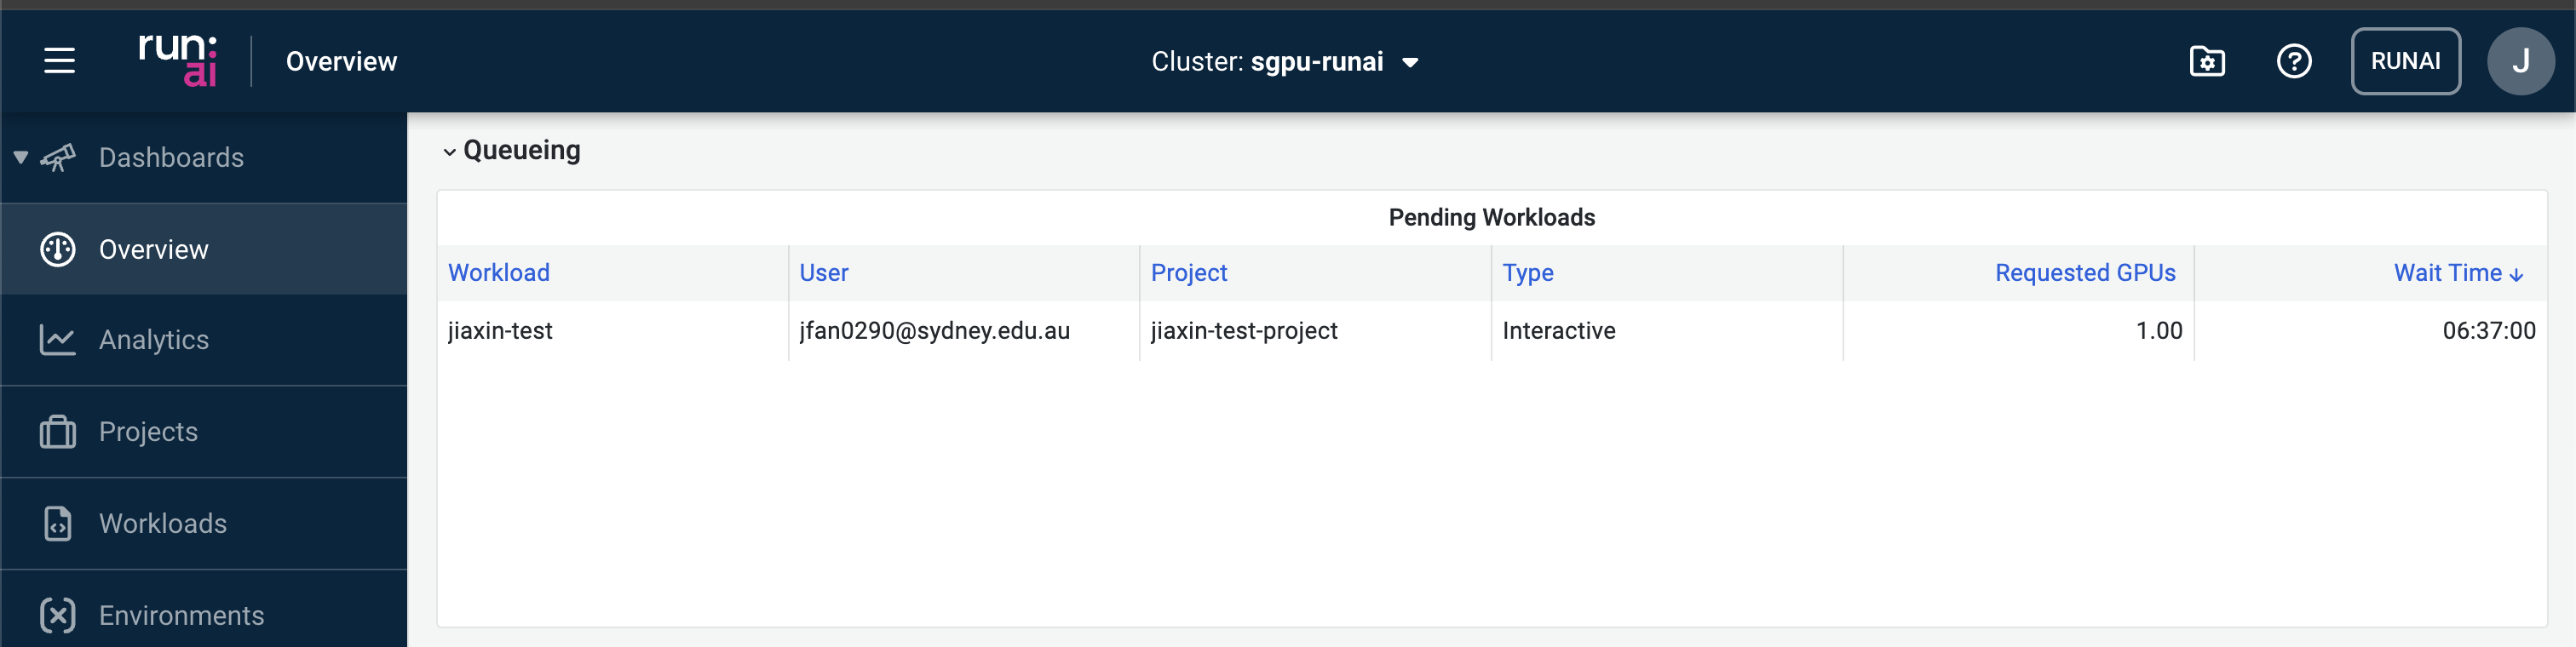
Queueing
Inspecting all queueing jobs. Possible reasons why jobs are queueing include:
- The number of GPUs requested to be allocated to the job has exceeded the remaining GPUs in the project.
- The job is waiting for other jobs to finish before it can be scheduled.
Idle GPUs
Displaying the number of idle GPUs currently allocated to running workloads. 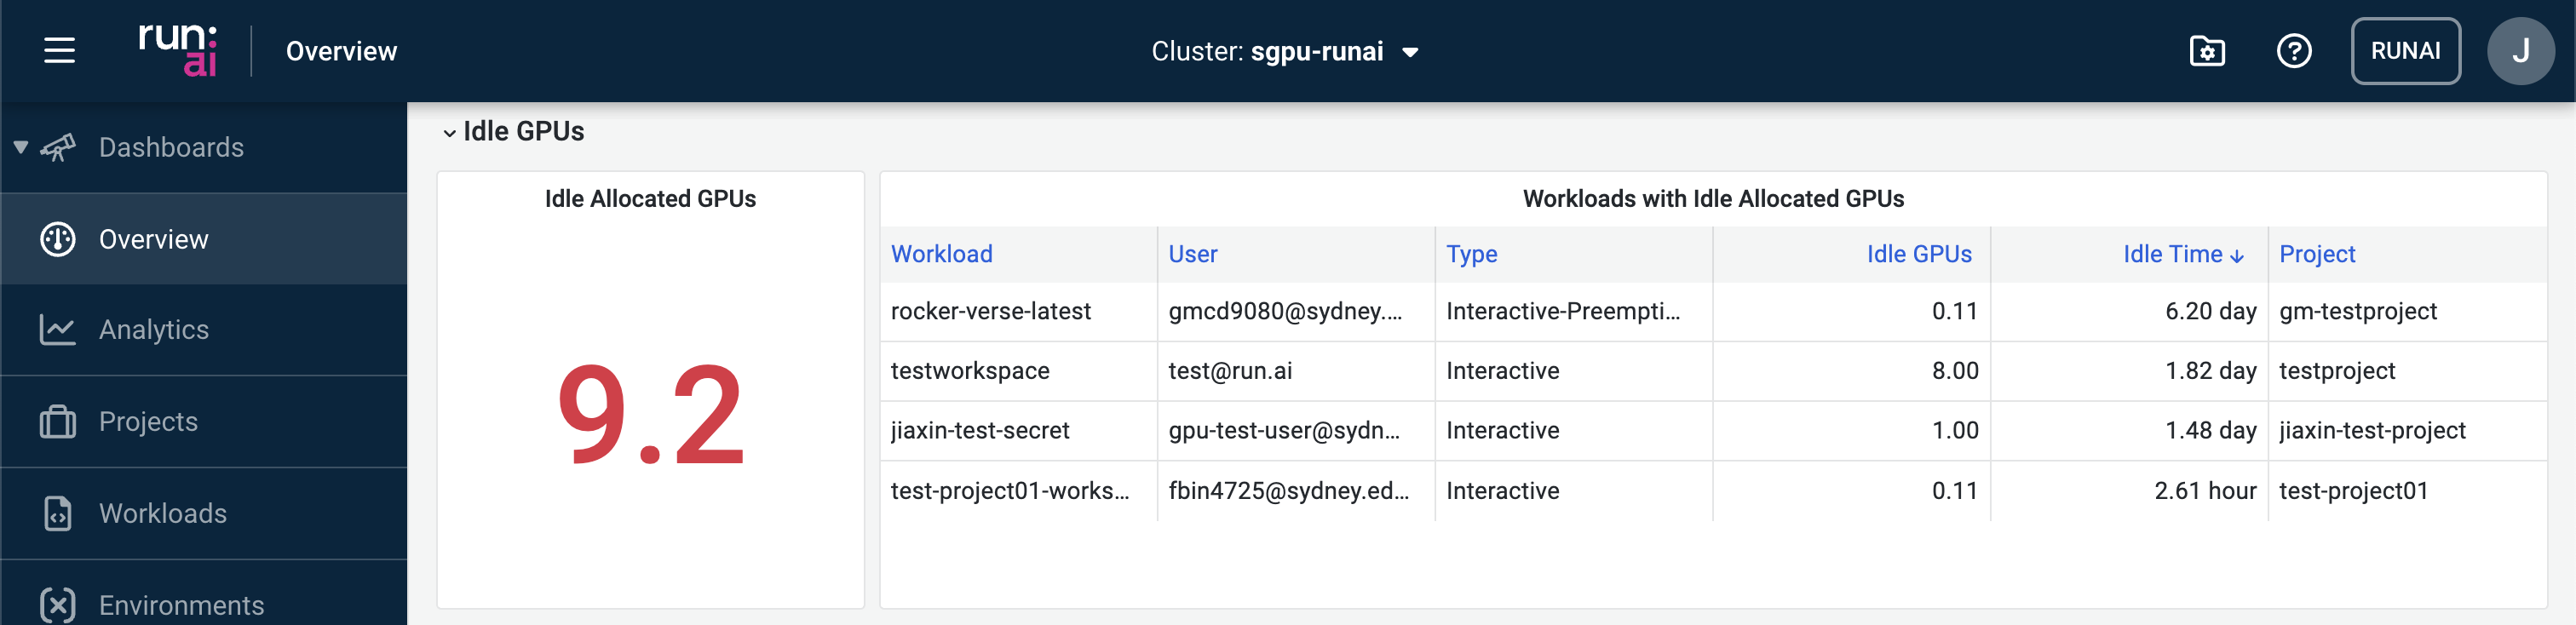
Running Workloads
Summary of the list of running workloads. 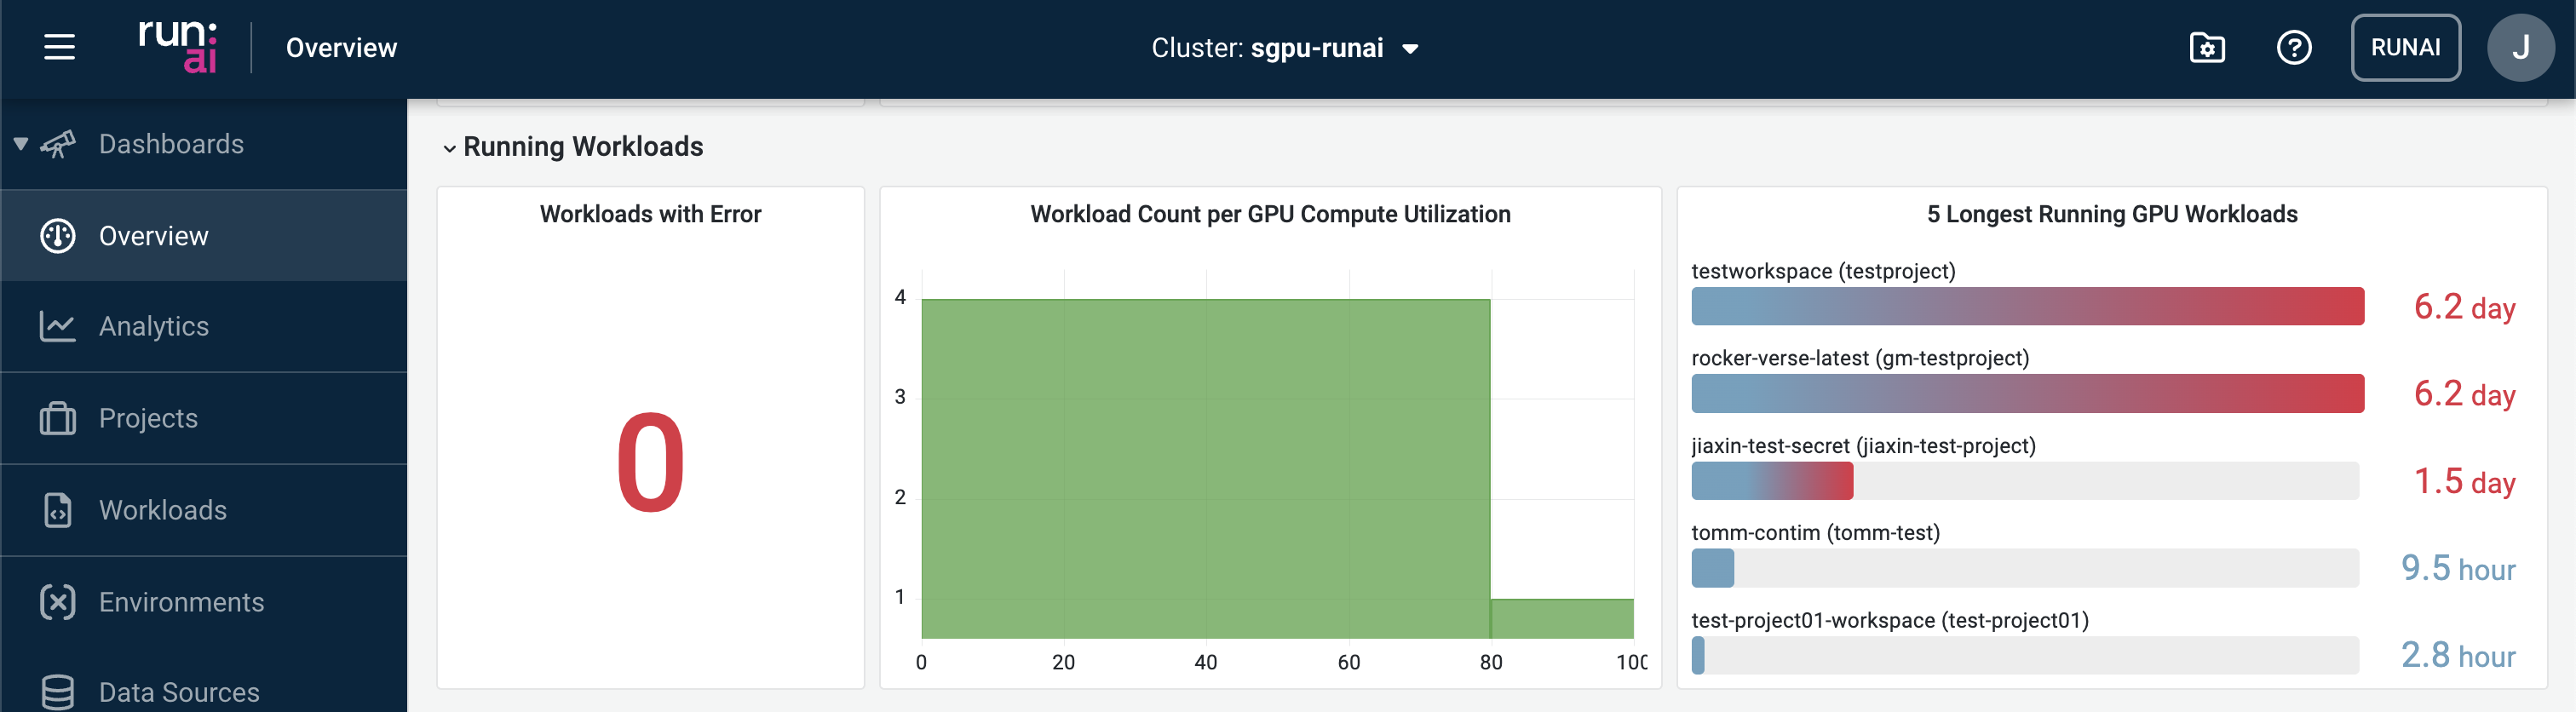
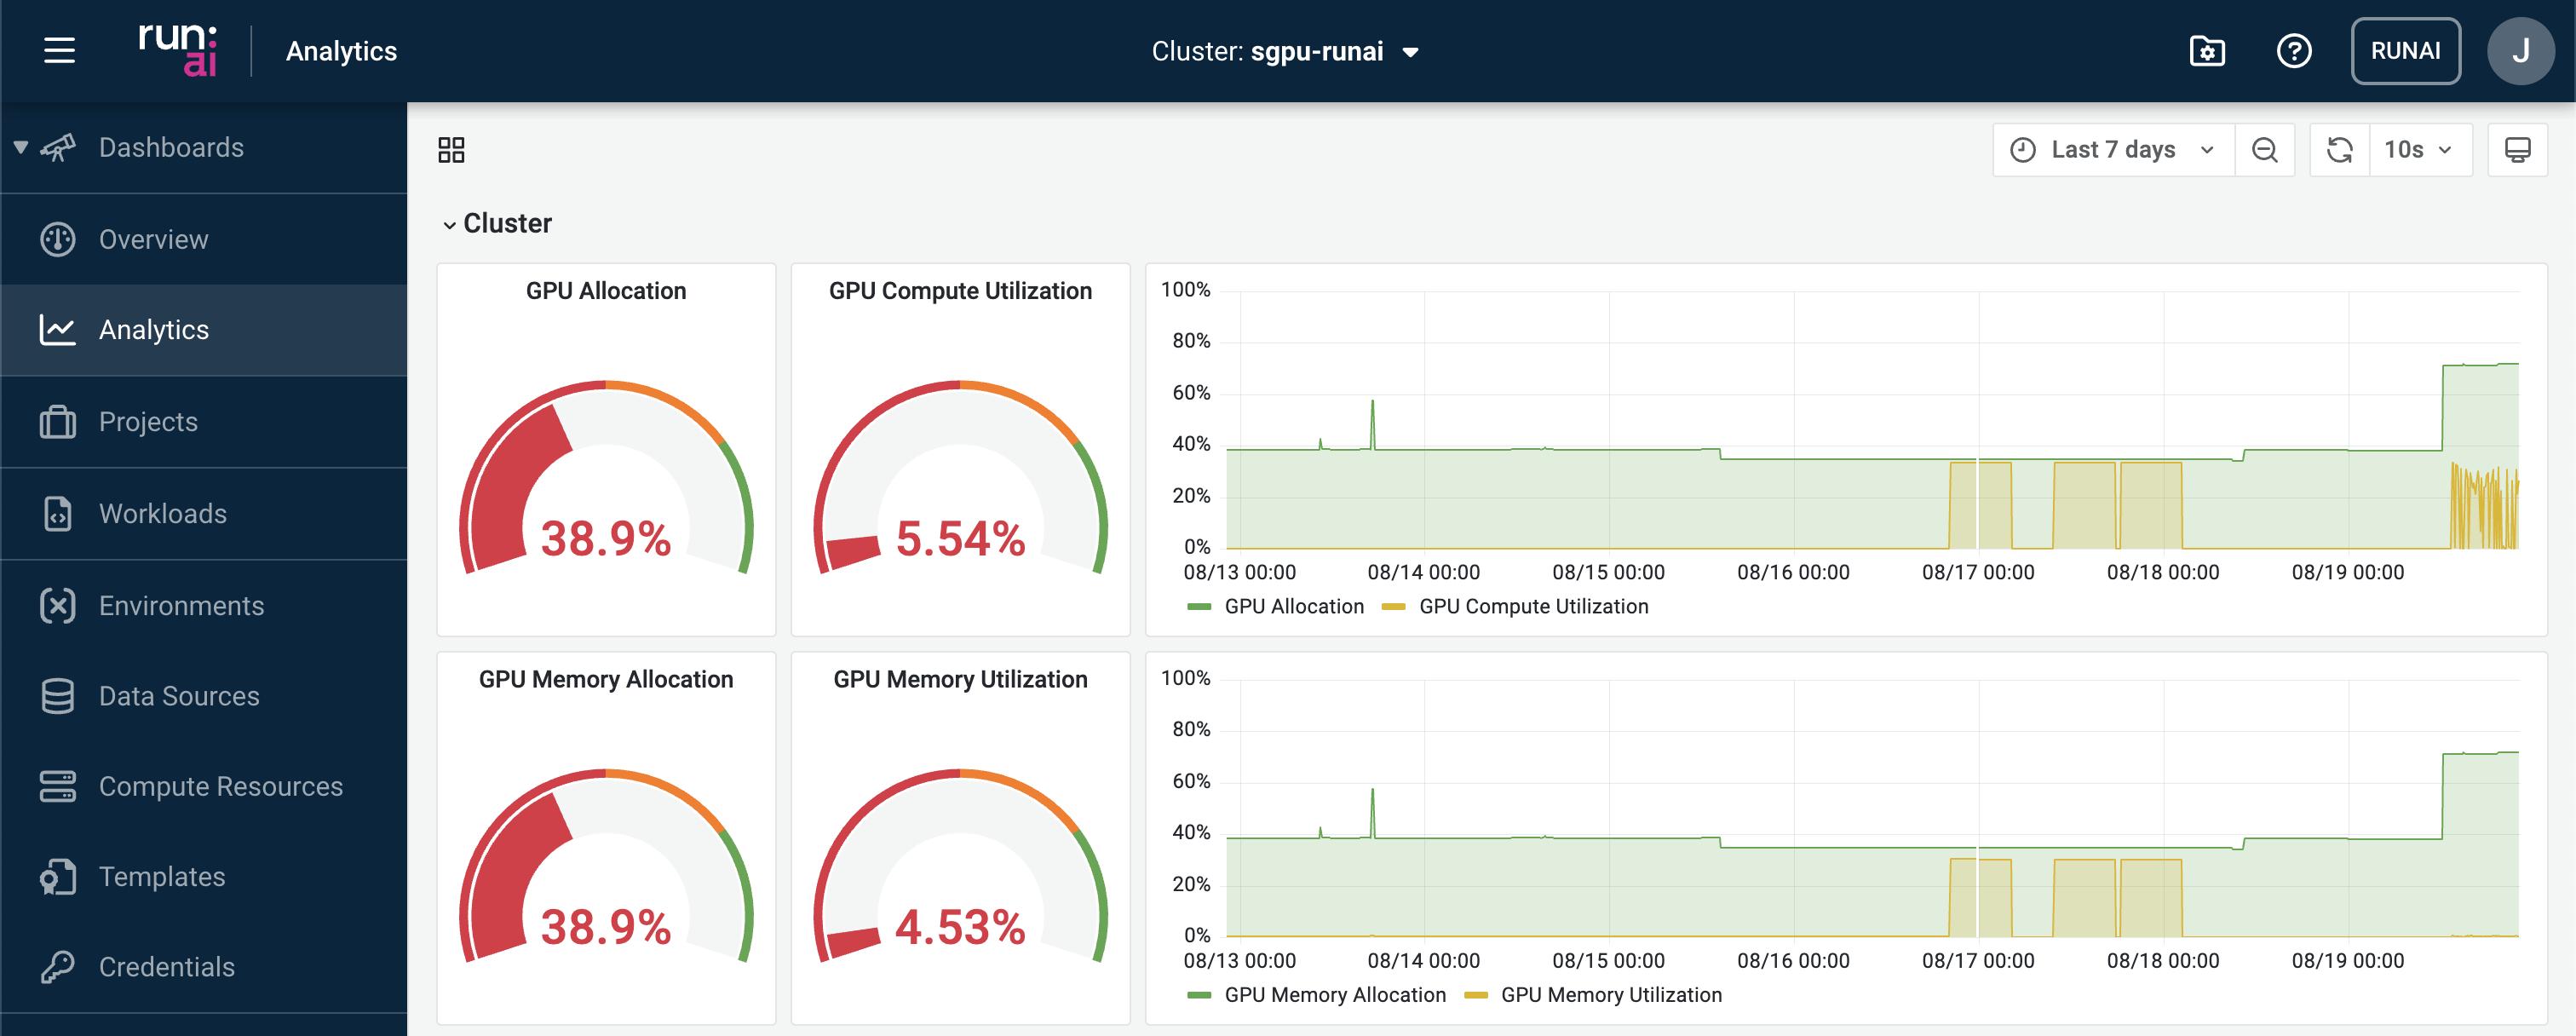
Analytics
This dashboard provides more detailed breakdowns of the DGX running status. Key statistics that are reported at separate levels:
- Cluster
- Project
- Workloads
- Nodes