- Fri 08 May 2020
- R
- Darya Vanichkina
- #r, #ggplot
This is not really a tech tidbit in itself, but is something that would be helpful for many of us when we need it, so I'm reposting/adapting it from StackOverflow / the interwebs.
In ggplot, in order to force the origin of the plot to start at (0,0) and not be padded, you need to add the following options:
scale_x_continuous(expand = c(0, 0)) + scale_y_continuous(expand = c(0, 0))
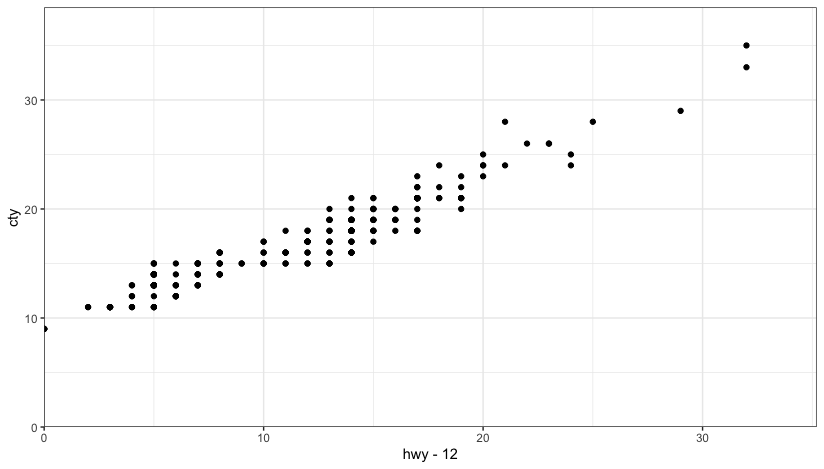
Default behavior results in
mpg %>% ggplot(aes(x = hwy-12, y = cty)) + geom_point()
Adding the above options results in things starting at (0,0), but you lose some data (as in this SO post)
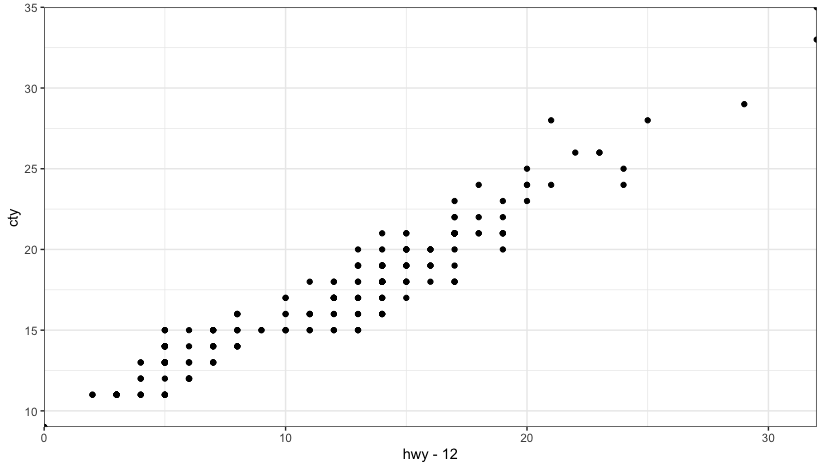
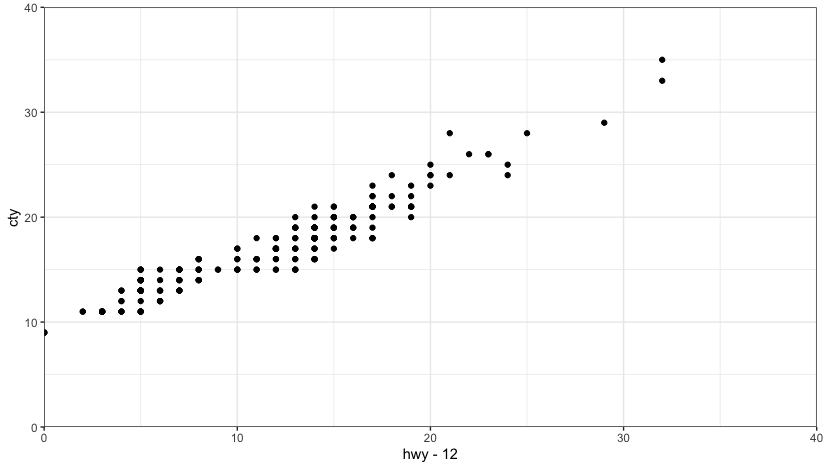
You also have to set the limits options to ensure all of the data is displayed!
mpg %>% ggplot(aes(x = hwy-12, y = cty)) + geom_point() + theme_bw() +
scale_x_continuous(limits = c(0,40), expand = c(0, 0)) +
scale_y_continuous(limits = c(0,40), expand = c(0, 0))
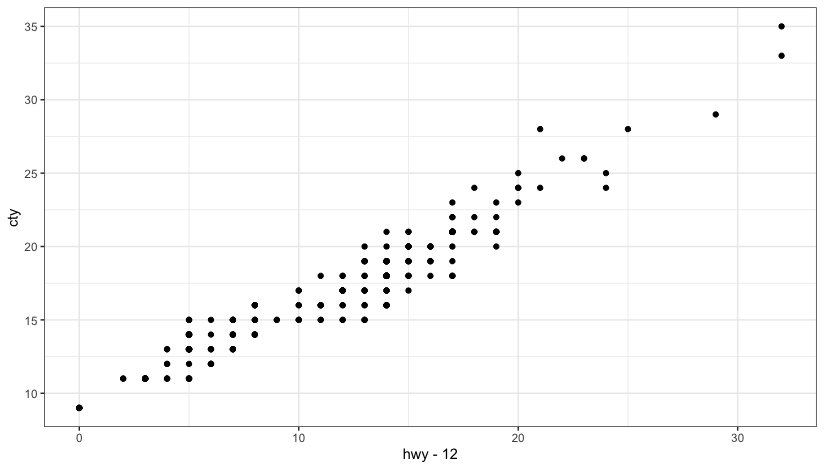
Finally, if you don't want to manually specify the limits you can use the below:
mpg %>% ggplot(aes(x = hwy-12, y = cty)) + geom_point() + theme_bw() +
    scale_y_continuous(limits = c(0, NA),
                       expand = expansion(mult = c(0, 0.1))) +
    scale_x_continuous(limits = c(0, NA),
                       expand = expansion(mult = c(0, 0.1)))